

School Transfers in Indiana Public School Corporations 2022-2023
Authors
Moaaz Hamid, Dr. Christopher Lubienski, Dr. Michele Moore
Center for Evaluation and Education Policy, Indiana University
Key Takeaways
- Transfers and choice options have led to significant enrollment shifts for school corporations.
- 47% of the net transfers out were from public school corporations to other public school corporations.
- 53% of the net transfers out were to nonpublic schools due to the choice scholarship program. These transfers result in irregular trends among schools gaining enrollment from school choice programs, where a small set of corporations gain or lose relatively higher proportions of enrollment than others.
- Within school choice programs, public/parent choice comprises the largest proportion of transfers out.
- Systemic and sustained inquiry with advanced statistical techniques can reveal valuable insights about the patterns and effects of school transfers in Indiana.
Overview
Over the last three decades, policymakers around the globe have emphasized parents’ choice of schools. Such policies are complex and highly contested and have led to mixed outcomes. Nevertheless, the number of school choice programs is increasing. The state of Indiana has one of the largest school choice programs in the country, with seven types of school choice programs.
- Indiana Choice Scholarship Program: Also known as the voucher program, this program started in 2011, allowing students in low- and middle-income families to receive vouchers to attend private schools.
- Education savings account: enacted first in 2021 for students with special needs; recently expanded to almost all students, who receive a portion of their assigned state education funding for private school tuition or other educational expenses, including special needs services and therapies, individual classes, testing fees, and transportation.
- Private school/homeschool deduction: Indiana’s program is a tax deduction for individuals who make educational expenditures for private schools or homeschooling on behalf of their dependent children.
- School scholarship tax credit: Indiana offers donors tax credits for contributing to Scholarship Granting Organizations (SGOs), nonprofits that distribute private school scholarships to students from low- and middle-income households.
- Public School Choice: Students in Indiana may choose public schools outside of their home corporation via open enrollment policies.
- Charter schools: Indiana allows for publicly funded but privately or independently run schools, often run by charter management organizations.
- Homeschooling: Homeschooling is allowed in Indiana, providing that parents follow certain laws and regulations.
Indiana's school choice programs have been the subject of national attention, as they are some of the most extensive and expensive in the country. School choice advocates argue that these programs empower the public/families to make choices about their children's education and can improve educational outcomes (Chubb & Moe, 1990). In contrast, opponents claim that they drain resources from public schools and exacerbate inequality without improving outcomes (Abdulkadiroglu et al., 2017; Canbolat, 2021; Fuentes-Rohwer, 2019; Lubienski et al., 2022; Ravitch, 2021). Despite the contention over the issue, school choice programs continue to expand and impact school corporations. These impacts need to be examined closely.
This report examines the transfer data in student enrollment in Indiana school corporations as reported by the Indiana Department of Education (IDOE). The reported school transfers and ADM file may be found at: https://www.in.gov/doe/it/data-centerand-reports/.
Indiana collects data on the transfer of public school students each year. This current report breaks down the information from Fall 2022. In total, 99,017 students transferred out from their home districts/corporations to other school corporations. Of those students, 46,345 (47%) transferred to other public school corporations, and Choice Scholarships went to 52,672 (53%) students.
The information provided by IDOE includes public charter schools as public schools.
Review of Public Transfers OUT to Other Public Schools (including Charters)
Table 1 shows the 25 school corporations with the largest number of students transferring out to another public school corporation. Six out of the 25 school corporations experienced a loss of more than 2000 students, with two school corporations experiencing a markedly greater loss than others. As might be expected, larger corporations generally lose a larger number of students. For instance, the Indianapolis Public School Corporation has the highest number of transfers, including 9,192 students who attended the IPS Innovation Charter Schools. The next 12 school corporations, in descending order of number of student outflows, experienced outflows ranging between 1000 and 2000 students. The remaining seven school corporations experienced outflows of less than 1,000 students. Table 1 presents student outflows only. Net outflows are presented in the subsequent tables.
| Top 25 school corporations with outflows to another public school corporation. School Corporations | Transfers Out to Another Public School (N) |
| Indianapolis Public Schools | 23459 |
| Gary Community School Corp | 6972 |
| South Bend Community School Corp | 4805 |
| Anderson Community School Corp | 3162 |
| Fort Wayne Community Schools | 2540 |
| Muncie Community Schools | 2370 |
| Elkhart Community Schools | 1958 |
| MSD Warren Township | 1902 |
| Kokomo School Corporation | 1892 |
| Greater Clark County Schools | 1727 |
| School City of Hammond | 1513 |
| MSD Lawrence Township | 1509 |
| Marion Community Schools | 1361 |
| School City of East Chicago | 1218 |
| Evansville Vanderburgh School Corp | 1185 |
| MSD Pike Township | 1065 |
| Perry Township Schools | 1064 |
| Richmond Community Schools | 1027 |
| New Albany-Floyd Co Con Sch | 979 |
| Monroe County Community Sch Corp | 910 |
| North Lawrence Com Schools | 884 |
| MSD Washington Township | 880 |
| MSD Wayne Township | 864 |
| Michigan City Area Schools | 849 |
| LaPorte Community School Corp | 839 |
Net Transfers Out
The analysis of net transfer out revealed that 165 school corporations have a net outflow to another public school corporation. They lost more students than they gained through student transfer provisions. Table 2 shows the net outflow numbers and percentages for the 28 school corporations with the largest net losses to other public schools. The top two school corporations experienced a net outflow of more than 100%, meaning that these schools lost more students than they gained, and the number of students that transferred out was greater than their enrollment in 2022. The next 11 school corporations, in descending order of net percentage outflow, experienced a net outflow between 25% and 53%. The remaining 15 school corporations experienced a net outflow between 15 and 25%.
| School Corporations | Net Transfers OUT (N) | Net Transfers OUT (% of Total ADM) |
| Gary Community School Corp | -6972 | -170.97% |
| Indianapolis Public Schools | -22500 | -102.15% |
| Northeast School Corp | -402 | -52.21% |
| Anderson Community School Corp | -3137 | -50.63% |
| Tri-Township Cons School Corp | -166 | -49.26% |
| Muncie Community Schools | -2187 | -43.05% |
| Hamilton Community Schools | -135 | -38.35% |
| Marion Community Schools | -1296 | -35.01% |
| School City of East Chicago | -1154 | -34.46% |
| Cannelton City Schools | -73 | -33.33% |
| Kokomo School Corporation | -1623 | -30.99% |
| South Bend Community School Corp | -4478 | -29.00% |
| Oregon-Davis School Corp | -127 | -25.60% |
| East Gibson School Corporation | -175 | -24.27% |
| C A Beard Memorial School Corp | -245 | -22.94% |
| North Lawrence Com Schools | -805 | -22.00% |
| Richmond Community Schools | -962 | -21.25% |
| South Dearborn Community Sch Corp | -407 | -20.70% |
| Lakeland School Corporation | -330 | -20.56% |
| Whitko Community School Corp | -241 | -19.82% |
| North Judson-San Pierre Sch Corp | -174 | -18.69% |
| North Adams Community Schools | -281 | -17.45% |
| Blackford County Schools | -256 | -17.10% |
| MSD Shakamak Schools | -114 | -16.91% |
| Madison Consolidated Schools | -452 | -16.71% |
| Tell City-Troy Twp School Corp | -225 | -16.07% |
| Pike County School Corp | -252 | -16.01% |
| Borden-Henryville School Corp | -263 | -15.33% |
Where Are Students Transferring To?
Analyzing the proportion of transfers out to nonpublic schools reveals that for a majority of the school corporations — 150 out of 290 (about 52%) — 2% or less of their transfers out are attributable to school choice scholarships. Within these school corporations, most of the transfers out from public school corporations were to other public schools, including public charter schools. Public charter schools are public schools that operate independently of the traditional public school system and are authorized to provide education services accessible to all students.
However, it is important to note that the overall proportion of transfers out (53%) are from choice scholarships, or “vouchers,” so while there are schools whose transfers out are largely to other public school corporations, the overall transfer out due to vouchers is higher than transfers out to other public school corporations. This trend is complicated due to public charter schools being presented as public schools in the IDOE data. Disaggregating public charter schools presented in Table 7 changes the net transfer out to other public schools trend presented in Table 2. Tables 3 and 4 present the top 25 school corporations with nonpublic transfers, accounting for 62% of the total nonpublic transfers out.
| Transfers out to nonpublic school corporations. Top 25 Corporations with Nonpublic Transfers | Number of Nonpublic Transfers (N) |
| Fort Wayne Community Schools | 5159 |
| Indianapolis Public Schools | 4184 |
| South Bend Community School Corp | 3553 |
| Evansville Vanderburgh School Corp | 2566 |
| Perry Township Schools | 2015 |
| East Allen County Schools | 1524 |
| School City of Hammond | 1159 |
| MSD Lawrence Township | 1009 |
| Franklin Township Com Sch Corp | 998 |
| MSD Pike Township | 876 |
| MSD Warren Township | 874 |
| MSD Washington Township | 820 |
| Hamilton Southeastern Schools | 799 |
| Bartholomew Con School Corp | 758 |
| Anderson Community School Corp | 744 |
| Tippecanoe School Corp | 719 |
| Penn-Harris-Madison School Corp | 618 |
| Gary Community School Corp | 592 |
| MSD Wayne Township | 588 |
| Elkhart Community Schools | 582 |
| Lafayette School Corporation | 576 |
| New Albany-Floyd Co Con Sch | 576 |
| Greater Clark County Schools | 514 |
| Lake Central School Corporation | 507 |
| Avon Community School Corp | 506 |
| Total | 32,816 |
Table 4 presents the top 25 school corporations based on transfers out to nonpublic schools. The total range of transfers from these 25 school corporations is between 7% and 23%, with 13 school corporations experiencing more than 10% transfers out and the remaining 12 between 7% and 10%.
| School Corporation | Nonpublic Transfers (% of ADM) |
| South Bend Community School Corp | 23.01% |
| Indianapolis Public Schools | 18.99% |
| Fort Wayne Community Schools | 18.03% |
| East Allen County Schools | 15.10% |
| Gary Community School Corp | 14.52% |
| North Adams Community Schools | 13.04% |
| Perry Township Schools | 12.42% |
| Anderson Community School Corp | 12.01% |
| Evansville Vanderburgh School Corp | 11.80% |
| Madison Consolidated Schools | 11.79% |
| School City of East Chicago | 11.20% |
| MSD Mount Vernon | 10.66% |
| School City of Hammond | 10.07% |
| Brownstown Cnt Com Sch Corp | 9.63% |
| MSD North Posey Co Schools | 9.19% |
| Seymour Community Schools | 8.91% |
| Franklin Township Com Sch Corp | 8.90% |
| Hanover Community School Corp | 8.81% |
| Michigan City Area Schools | 8.78% |
| Lake Station Community Schools | 8.36% |
| North Judson-San Pierre Sch Corp | 8.27% |
| MSD Martinsville Schools | 8.24% |
| MSD Pike Township | 8.20% |
| Washington Community Schools | 7.84% |
| Kankakee Valley School Corp | 7.83% |
When analyzing the transfer data by a corporation, charter, or nonpublic school, some trends address which public school corporations, charters, and nonpublics gained from choice programs. These trends are presented in the tables below.
Table 5 presents transfers out disaggregated by “Parent Choice” and “Public Other”. Public other is when a student has an alternative placement, to an alternative school or onsite behavioral school, where students are sent by a school’s and not a parent’s choice. 36 corporations gained at least 500 or more students from choice programs combined. 28 out of the 36 school corporations gained from 500 to 1000 students from parent choice, six school corporations gained 1000 to 2000 students, and the top two received 2859 and 6939 students, respectively. For public other transfers, 20 school corporations gained from 1 to 59 students, whereas 12 school corporations did not gain any students.
| School corporations | Parent Choice (N) | Public Other (N) |
| Union School Corporation | 6939 | 0 |
| Clarksville Community School Corp | 2859 | 0 |
| Penn-Harris-Madison School Corp | 1765 | 0 |
| MSD Lawrence Township | 1696 | 59 |
| MSD Wayne Township | 1294 | 0 |
| School City of Mishawaka | 1200 | 54 |
| MSD Warren Township | 1093 | 0 |
| Beech Grove City Schools | 1088 | 10 |
| Frankton-Lapel Community Schools | 981 | 3 |
| Indianapolis Public Schools | 959 | 0 |
| New Albany-Floyd Co Con Sch | 911 | 7 |
| East Allen County Schools | 872 | 40 |
| MSD Washington Township | 788 | 6 |
| Concord Community Schools | 787 | 13 |
| Cloverdale Community Schools | 764 | 0 |
| Mooresville Con School Corp | 757 | 1 |
| MSD Wabash County Schools | 746 | 50 |
| Greenwood Community Sch Corp | 695 | 21 |
| Eastern Howard School Corporation | 687 | 1 |
| Silver Creek School Corporation | 672 | 0 |
| Southern Hancock Co Com Sch Corp | 667 | 0 |
| Mississinewa Community School Corp | 645 | 0 |
| New Prairie United School Corp | 628 | 6 |
| South Madison Com Sch Corp | 617 | 0 |
| Yorktown Community Schools | 574 | 8 |
| Northwestern School Corp | 572 | 5 |
| Western School Corporation | 563 | 0 |
| Mt Vernon Community School Corp | 561 | 24 |
| Daleville Community Schools | 532 | 0 |
| Center Grove Community School | 525 | 0 |
| John Glenn School Corporation | 522 | 6 |
| Oak Hill United School Corp | 522 | 2 |
| Madison-Grant United School Corp | 520 | 0 |
| Middlebury Community Schools | 516 | 9 |
| Plainfield Community School Corp | 514 | 20 |
| Centerville-Abington Com Schs | 501 | 0 |
| Totals | 36,532 | 345 |
Figure 1 below shows how a few schools have disproportionately received more enrollment boosts from public/parent choice than others. The first eight schools comprise more than 50% of the enrollment gains from public/parent choice programs among schools that gained at least 500 students from the program.
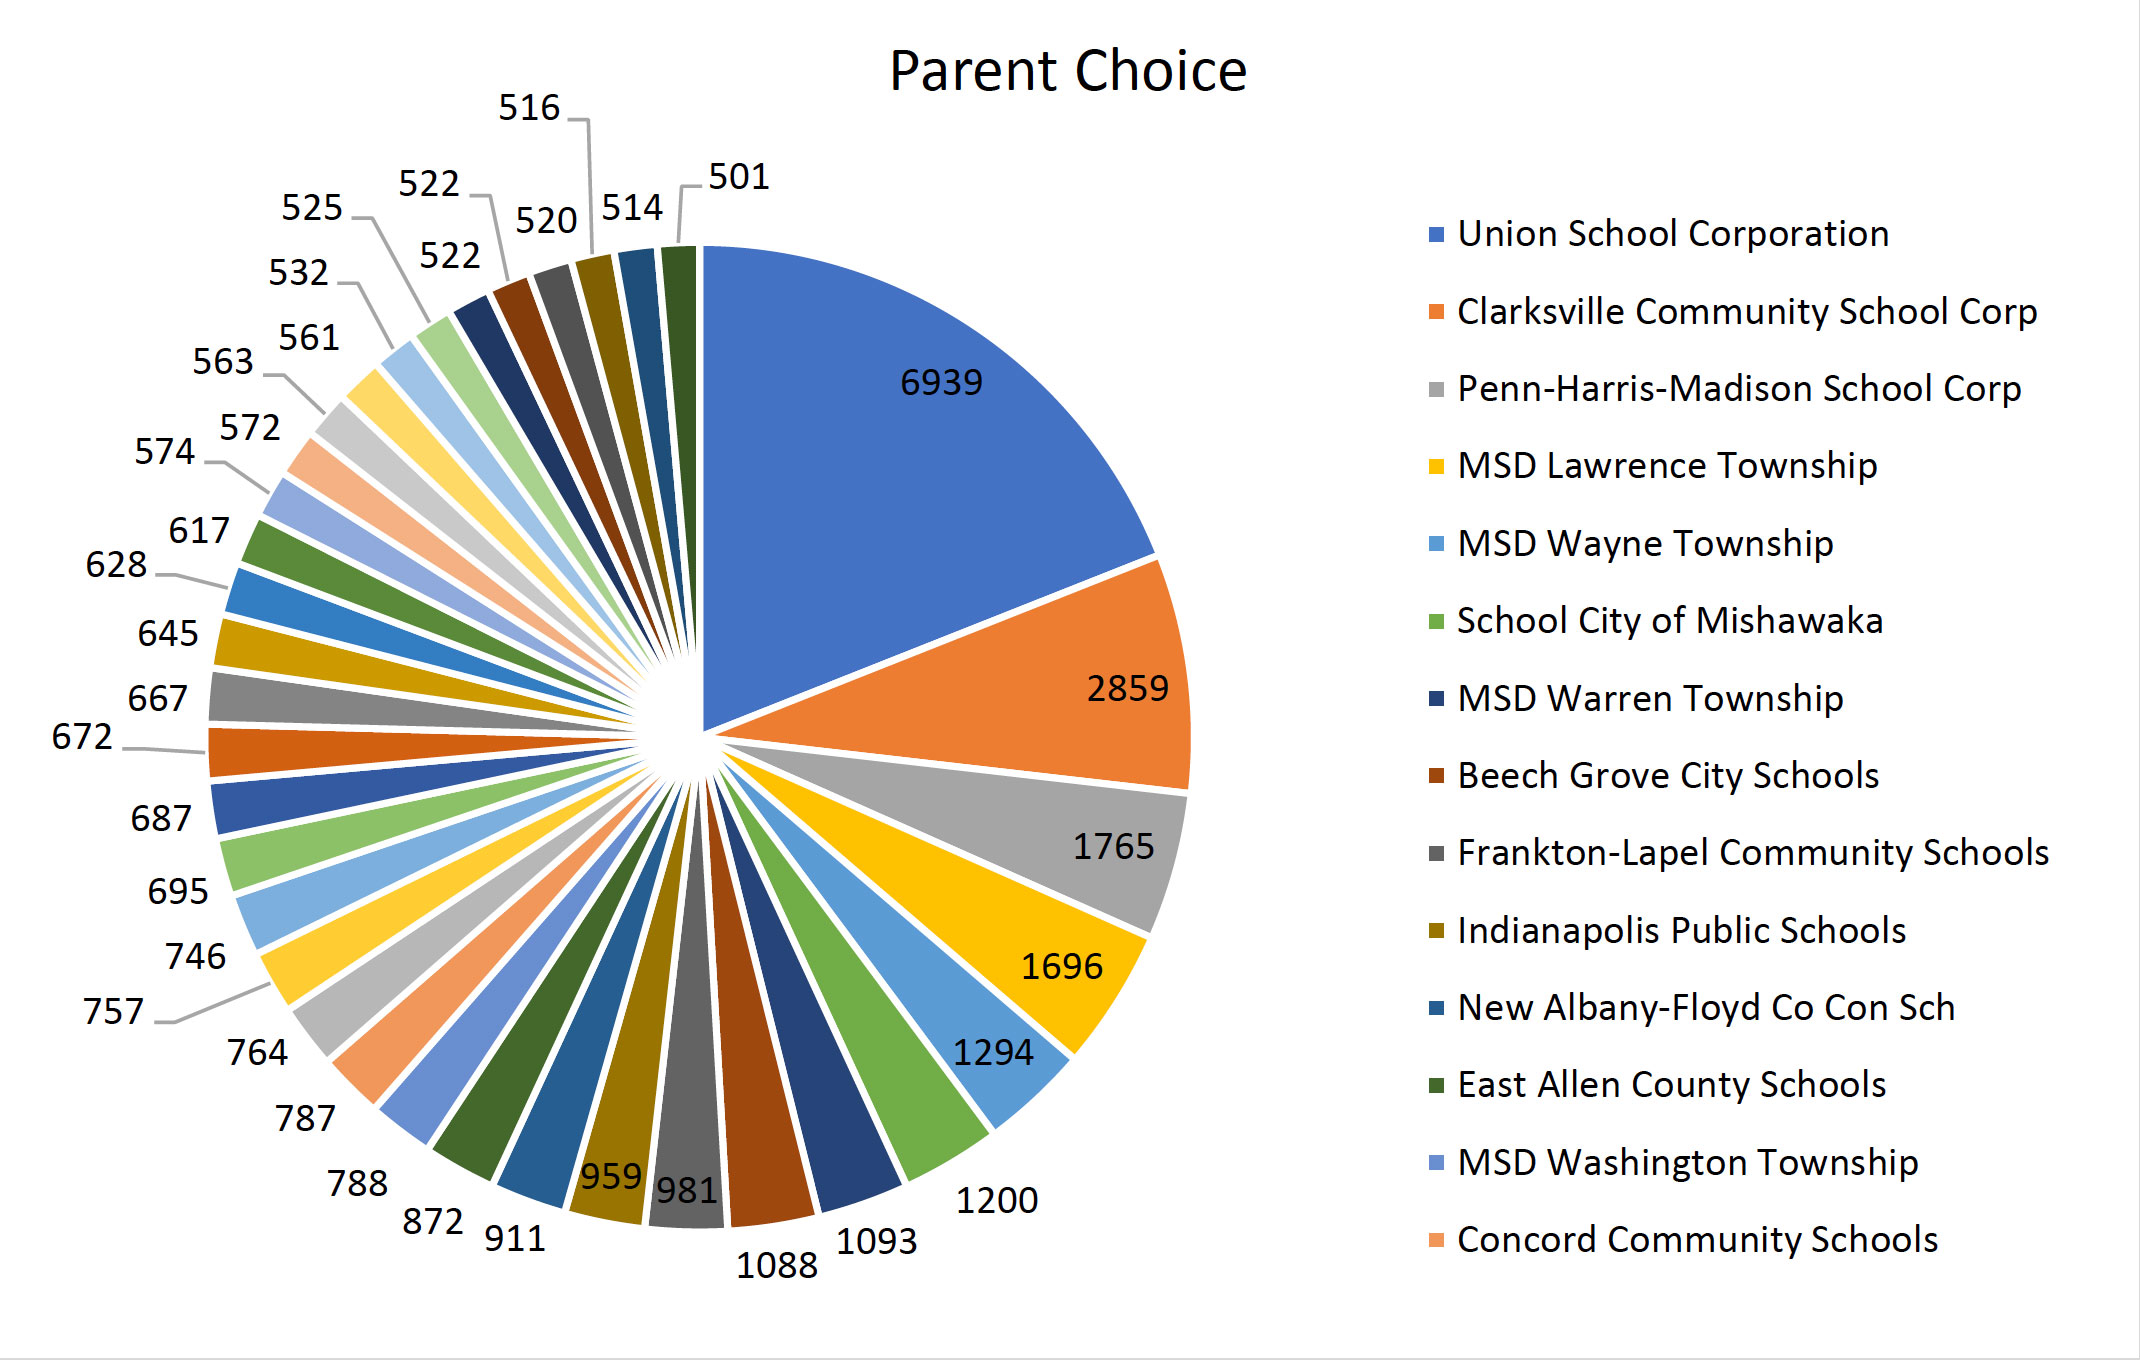
Table 6 lists the 62 school corporations receiving over 20% of their enrollment from public/parent choice programs. The top two school corporations gained 95.87% and 71% of their students from parent choice, which in large part can be attributed to online schools administered by these two school corporations, as shown in Figure 2.
Figure 2 shows the trends in enrollment numbers from 2006 – 2022 in Union school corporation and Clarksville community school corporation, which indicates that while enrollment in in-person schools in the two school corporations remains approximately constant, the total enrollment gains are from enrollment spikes in online schools post2018 (i.e., 6795 – 7131 – Indiana Digital Jr and High School, 6795 – 7142 – Indiana Digital Alternative School, 6795 – 7122 – Indiana Digital Elementary, and 1000 – 1007 – Indiana Gateway Digital Academy). To reinforce the significance of online schools in these enrollment spikes, it is noteworthy that the school corporation (Union School Corporation) with the highest enrollment increase has three online schools, two starting in 2019 and one in 2020. Whereas, Clarksville Community School Corporation, with the second highest enrollment increase, has only one online school that started in 2022. It is also important to highlight the huge enrollment gap (1252.66%) between the two school corporations with the highest enrollment gains that can be attributed to the number of online schools and their duration of operations. The availability of state-wide data on online schools might also reveal other interesting trends. However, here, it is evident that online schools have played a significant role in boosting enrollment for those two school corporations, whose enrollment gains are markedly higher than gains observed in all other school corporations.
Table 6 shows four school corporations gained 42% to 52% of students from public/parent choice. 22 school corporations gained 30% to 40% of their students, while the remaining 34 school corporations gained between 10% and 30% of their students in this manner.
| 62 school corporations that receive 20% or more of their enrollment from public/parent choice transfers in. School corporations | Parent Choice at a Percent (%) of ADM |
| Union School Corporation | 95.87% |
| Clarksville Community School Corp | 71.00% |
| Daleville Community Schools | 52.26% |
| Cowan Community School Corp | 48.29% |
| Cloverdale Community Schools | 45.31% |
| Eastern Howard School Corporation | 42.11% |
| South Central Com School Corp | 39.05% |
| Cannelton City Schools | 38.81% |
| Beech Grove City Schools | 38.62% |
| Taylor Community School Corp | 38.00% |
| Union-North United School Corp | 37.21% |
| MSD Wabash County Schools | 35.13% |
| School City of Whiting | 34.57% |
| MSD of New Durham Township | 34.53% |
| Northeastern Wayne Schools | 34.49% |
| Liberty-Perry Community Sch Corp | 34.26% |
| South Henry School Corp | 33.86% |
| Lanesville Community School Corp | 33.47% |
| Madison-Grant United School Corp | 33.31% |
| Southern Wells Com Schools | 32.96% |
| Eastern Hancock Co Com Sch Corp | 32.74% |
| Tri-Central Community Schools | 32.27% |
| Oak Hill United School Corp | 32.21% |
| Frankton-Lapel Community Schools | 31.84% |
| Barr-Reeve Community Schools Inc | 31.69% |
| West Washington School Corp | 31.69% |
| Northwestern School Corp | 31.14% |
| Monroe Central School Corp | 31.02% |
| Lake Ridge New Tech Schools | 29.32% |
| Blue River Valley Schools | 29.28% |
| Wes-Del Community Schools | 29.15% |
| Perry Central Com Schools Corp | 29.11% |
| Centerville-Abington Com Schs | 28.19% |
| Milan Community Schools | 27.74% |
| Oregon-Davis School Corp | 27.62% |
| Mississinewa Community School Corp | 26.53% |
| Adams Central Community Schools | 26.27% |
| John Glenn School Corporation | 26.24% |
| Nettle Creek School Corporation | 25.30% |
| Randolph Southern School Corp | 25.29% |
| Tri-Township Cons School Corp | 24.93% |
| Wabash City Schools | 24.67% |
| School City of Mishawaka | 24.45% |
| Orleans Community Schools | 24.12% |
| Caston School Corporation | 24.07% |
| Eastbrook Community Sch Corp | 23.14% |
| Northwestern Con School Corp | 22.85% |
| South Knox School Corp | 22.69% |
| River Forest Community Sch Corp | 22.36% |
| Western School Corporation | 22.14% |
| Argos Community Schools | 22.06% |
| Southwestern-Jefferson Co Con | 21.93% |
| Flat Rock-Hawcreek School Corp | 21.91% |
| New Prairie United School Corp | 21.79% |
| Nineveh-Hensley-Jackson United | 21.46% |
| Yorktown Community Schools | 21.40% |
| Silver Creek School Corporation | 21.37% |
| Shenandoah School Corporation | 21.25% |
| Clinton Prairie School Corporation | 21.21% |
| Lawrenceburg Community School Corp | 20.99% |
| Medora Community School Corp | 20.48% |
| Clinton Central School Corporation | 20.42% |
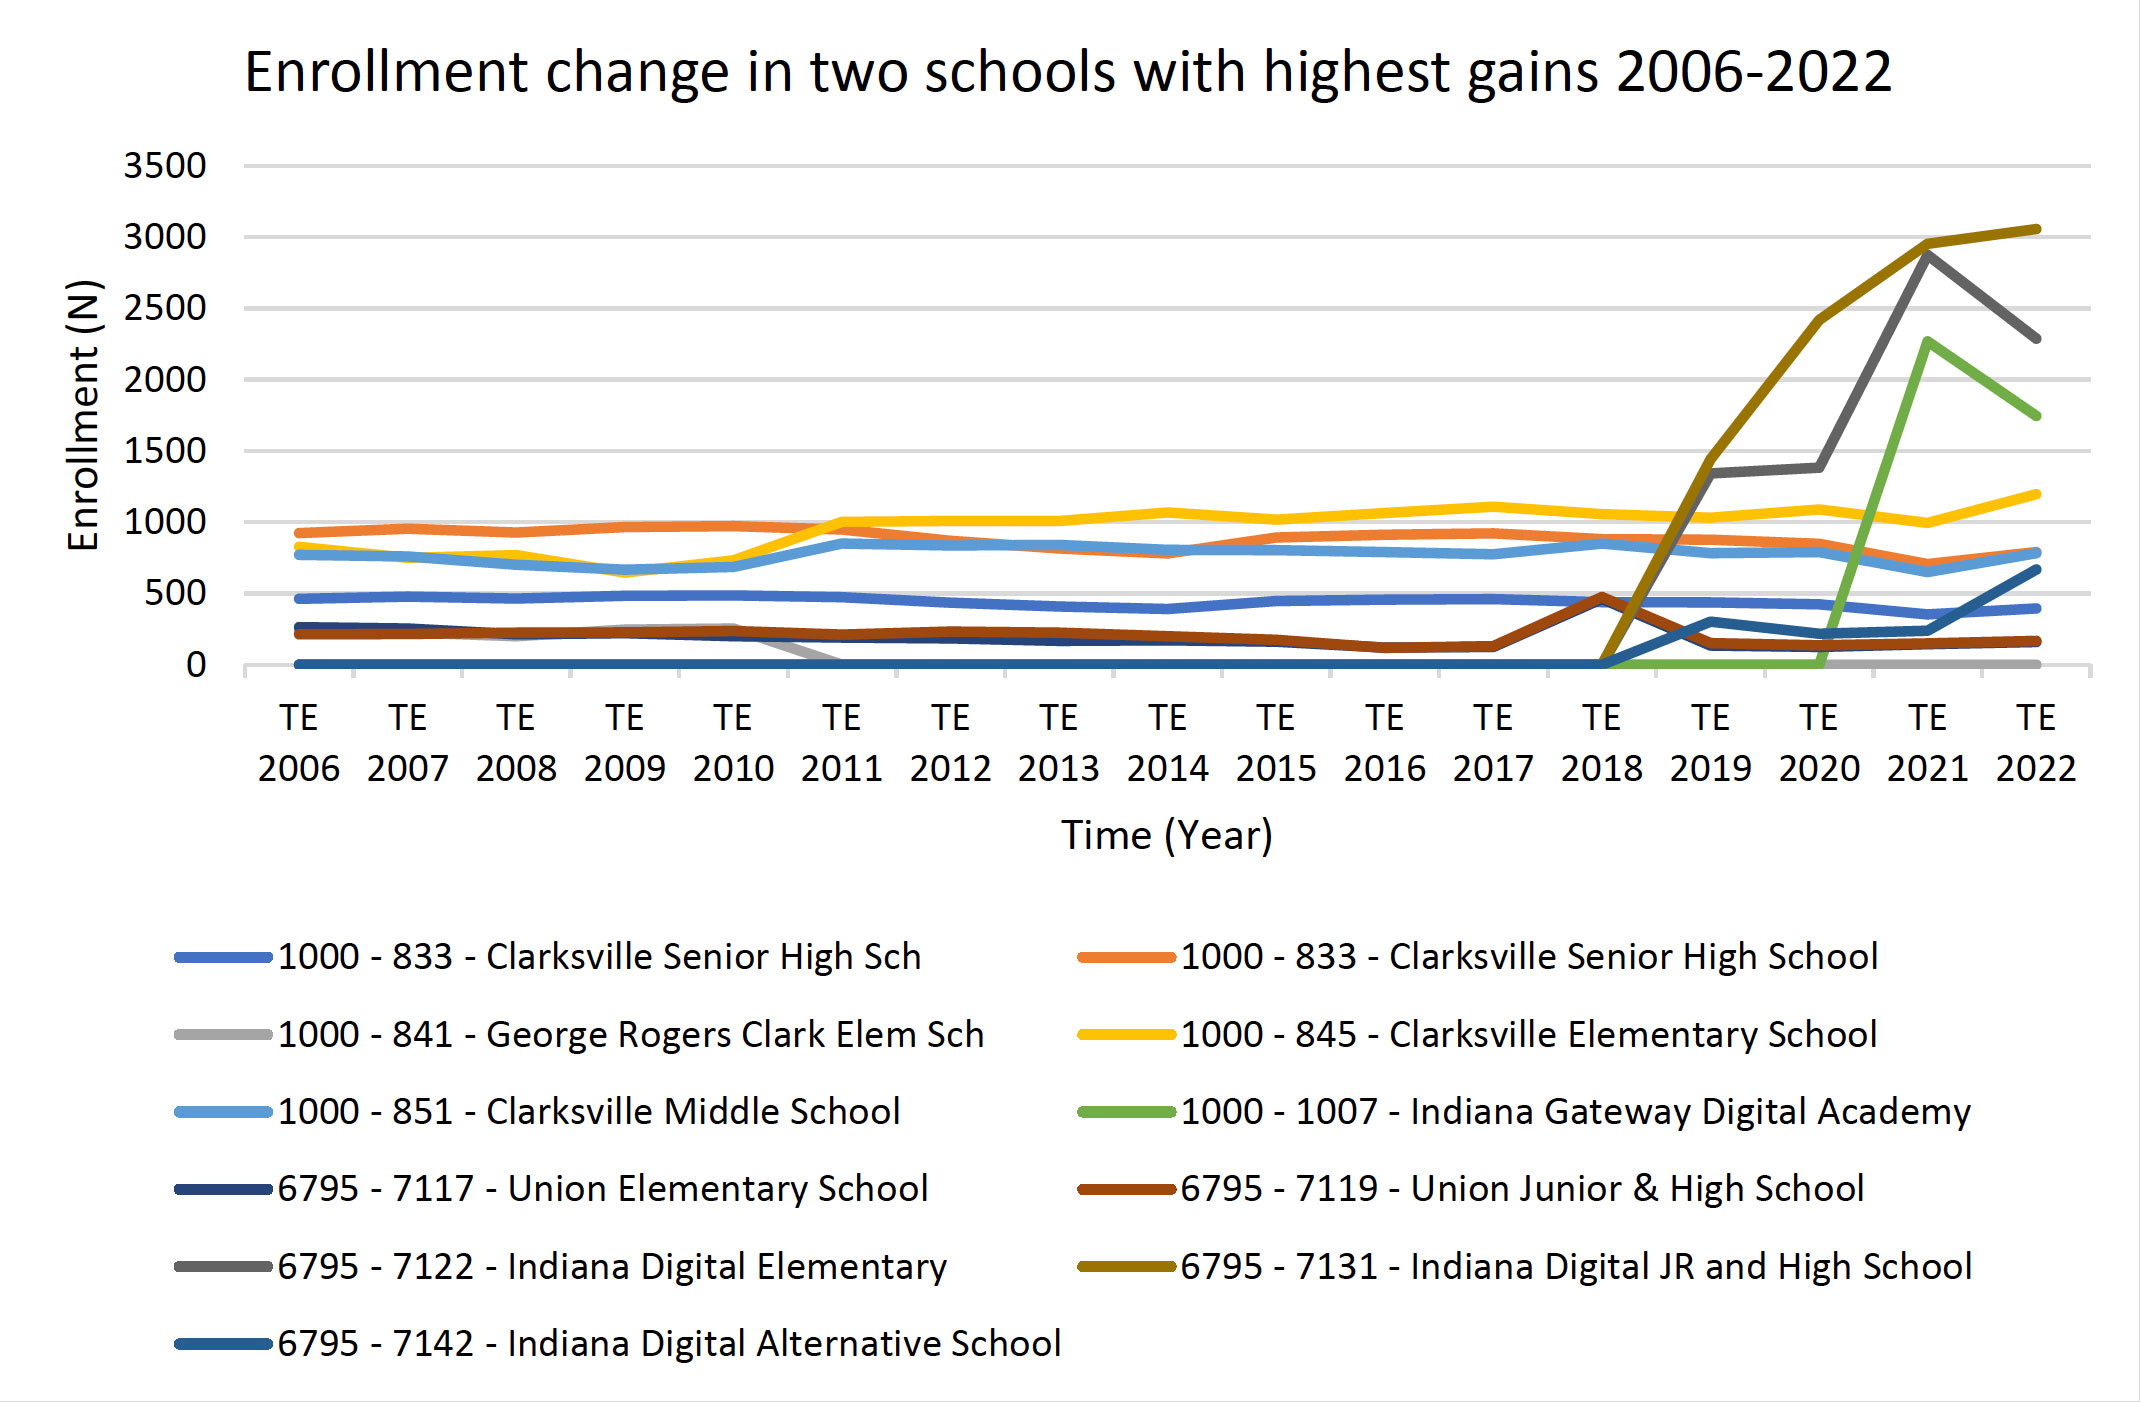
Table 7 presents the 64 public charter schools that received students transferring from public school corporations. The school corporations are organized in descending order based on the number of students received by the public charter schools. The top three school corporations received more than 1000 students, of which the top school corporation received 5863 students (about more than four times the students received by the second highest school corporation). 31 school corporations received 500 to 999 students, while the remaining 30 school corporations received less than 500 students.
| School corporations | Sum of Public Transfers: Charter (N) |
| Indiana Connections Academy | 5863 |
| 21st Century Charter Sch of Gary | 1350 |
| Gary Lighthouse Charter School | 1146 |
| Herron Charter* | 997 |
| Irvington Community School | 942 |
| Options Charter Schools | 915 |
| Victory College Prep Academy | 906 |
| Anderson Preparatory Academy | 850 |
| Thea Bowman Leadership Academy | 841 |
| Paramount Brookside | 812 |
| Christel House Academy South | 781 |
| Indiana Connections Career Academy | 753 |
| Global Preparatory Academy | 740 |
| KIPP Indy Unite Elementary | 704 |
| Charter School of the Dunes | 689 |
| Hoosier College and Career Academy | 684 |
| Burris Laboratory School | 681 |
| Rock Creek Community Academy | 674 |
| Enlace Academy | 663 |
| Aspire Charter Academy | 660 |
| Matchbook Learning | 655 |
| IN Math & Science Academy - North | 637 |
| Success Academy Primary School | 606 |
| Andrew J Brown Academy | 600 |
| SE Neighborhood Sch of Excellence | 568 |
| Purdue Polytechnic High School Ind | 565 |
| Discovery Charter School | 564 |
| Dugger Union Community School Corp | 564 |
| Hammond Academy of Science & Tech | 562 |
| The PATH School | 540 |
| IN Math & Science Academy | 539 |
| Phalen Leadership Academy at Franc | 523 |
| Seven Oaks Classical School | 512 |
| Community Montessori Inc | 504 |
| James and Rosemary Phalen Leadersh | 478 |
| East Chicago Lighthouse Charter | 477 |
| Christel House Academy West | 471 |
| Career Academy High School | 433 |
| Tindley Genesis Academy | 433 |
| Vision Academy | 429 |
| East Chicago Urban Enterprise Acad | 424 |
| Riverside High School | 410 |
| Career Academy Middle School | 394 |
| Signature School Inc | 393 |
| Timothy L Johnson Academy | 390 |
| Charles A Tindley Accelerated Sch | 389 |
| KIPP Indy Legacy High | 384 |
| KIPP Indy College Prep Middle | 379 |
| PLA at George H Fisher School 93 | 357 |
| Steel City Academy | 349 |
| Phalen Virtual Leadership Academy | 343 |
| Adelante Schools | 334 |
| The Bloomington Project School | 331 |
| Circle City Prep Charter School | 323 |
| Indiana Agriculture and Technology | 314 |
| Urban ACT Academy | 308 |
| Avondale Meadows Academy | 303 |
| James & Rosemary Phalen Leadership | 284 |
| Purdue Polytechnic High Sch North | 281 |
| Paramount Cottage Home | 271 |
| Phalen Leadership Academy at Louis | 271 |
| Joshua Academy | 265 |
| Renaissance Academy Charter School | 247 |
| Lawrence County Independent School | 242 |
| Paramount Englewood | 239 |
| Phalen Leadership Academy - IN Inc | 237 |
| Geist Montessori Academy | 233 |
| Liberty Grove Schools | 230 |
| Tindley Summit Academy | 228 |
| HIM By HER Collegiate School for t | 224 |
| BELIEVE Circle City High School | 213 |
| pilotED Schools | 213 |
| Indianapolis Metropolitan High Sch | 212 |
| Higher Institute of Arts & Tech | 206 |
| Timothy L. Johnson Academy Middle | 196 |
| Avondale Meadows Middle School | 195 |
| Indiana Academy for Sci Math Hmn | 195 |
| Inspire Academy - A Sch of Inquiry | 181 |
| Damar Charter Academy | 180 |
| Herron Preparatory Academy | 176 |
| Invent Learning Hub | 169 |
| Paramount Online Academy | 165 |
| Indy Steam Academy | 164 |
| Springville Community Academy | 164 |
| Canaan Community Academy | 160 |
| GEO Next Generation Academy | 158 |
| ACE Preparatory Academy | 156 |
| Allegiant Preparatory Academy | 145 |
| The Nature School of Central India | 145 |
| Gary Middle College | 144 |
| Purdue Polytechnic High School Sou | 143 |
| Rooted School Indianapolis | 137 |
| Neighbors' New Vistas High School | 128 |
| Mays Community Academy | 119 |
| Dynamic Minds Academy | 107 |
| Otwell Miller Academy | 95 |
| Rural Community Schools Inc | 87 |
| Smith Academy for Excellence | 76 |
| Vanguard Collegiate of Indy | 70 |
| The Genius School | 69 |
| Promise Prep | 66 |
| Monarca Academy | 39 |
| The Hope Academy, Inc. | 32 |
| Grand Total | 46,393 |
Table 8 presents the number of students nonpublic providers gained from Indiana’s Choice Scholarship. Overall, 304 nonpublic schools received funds from the voucher program for 52,674 students in total. The 48 schools presented in the table below gained 300 or more students. The top five schools gained 600 to 700 students, followed by eight schools that gained 500 to 600 students, followed by 13 schools that gained 400 to 500 students, while the remaining 22 schools gained 300 to 400 students.
| Nonpublic Schools | City | Sum of Non-Public Transfers: Choice Scholarship (N) |
| Saint Charles Borromeo School | Bloomington | 700 |
| Saint Joseph School | South Bend | 672 |
| Roncalli High School | Indianapolis | 655 |
| Saint John The Baptist School | New Haven | 607 |
| Heritage Christian School | Indianapolis | 606 |
| Bishop Dwenger High School | Fort Wayne | 589 |
| Saint Vincent DePaul School | Fort Wayne | 589 |
| Saint Jude Elementary School | Fort Wayne | 547 |
| Marian High School | Mishawaka | 525 |
| Evansville Christian Sch Newburgh | Newburgh | 524 |
| Suburban Christian School | Indianapolis | 521 |
| Faith Christian School | Lafayette | 517 |
| Cardinal Ritter High School | Indianapolis | 509 |
| Christian Academy of Indiana | New Albany | 493 |
| Saint Michael School | Bloomington | 457 |
| Holy Cross School | Bloomington | 456 |
| Saint Joseph High School | South Bend | 452 |
| Crown Point Christian School | Saint John | 446 |
| Cathedral High School | Indianapolis | 436 |
| Bishop Luers High School | Fort Wayne | 433 |
| Holy Cross Lutheran School | Indianapolis | 425 |
| Bishop Noll Institute | Hammond | 416 |
| Elkhart Christian Academy | Elkhart | 414 |
| Lakewood Park Christian School | Auburn | 414 |
| Saint Mark School | Indianapolis | 411 |
| Scecina Memorial High School | Indianapolis | 405 |
| Trinity Lutheran School | Crown Point | 399 |
| Blackhawk Christian Elementary Sch | Fort Wayne | 398 |
| Concordia Lutheran High School | Fort Wayne | 398 |
Christ The King School | South Bend | 382 |
| Tabernacle Christian School | Martinsville | 376 |
| Holy Family School | New Albany | 361 |
| Saint Mary School | North Vernon | 357 |
| Greenwood Christian Academy | Mooresville | 351 |
| Mooresville Christian Academy | Mooresville | 343 |
| Highland Christian School | Highland | 337 |
| Saint Lawrence School | Lawrenceburg | 327 |
| Saint Casimir School | Hammond | 324 |
| Holy Spirit School | Indianapolis | 323 |
| Immanuel Lutheran School | Seymour | 321 |
| Saint Elizabeth Ann Seton Catholic | Carmel | 321 |
| Our Lady Of Grace School | Noblesville | 314 |
| Bishop Chatard High School | Indianapolis | 313 |
| MTI School of Knowledge | Indianapolis | 312 |
| Blackhawk Christian Mdl/High Sch | Fort Wayne | 311 |
| Reitz Memorial High School | Evansville | 311 |
| Saint Barnabas School | Indianapolis | 311 |
| Concordia Lutheran School | Fort Wayne | 310 |
This report presents Indiana DoE data on student transfers through some of Indiana’s school choice programs. The findings demonstrate a pattern of “winners” and “losers” under these choice policies. The data show some intriguing patterns of student movements, including shifts in students from multiple corporations to a small number of corporations with online schooling. Additionally, many students have moved from public to private schools, but often not in areas with the greatest economic or educational needs, contrary to policymakers' expectations.
As a descriptive presentation of these data, the report offers possibilities for further, more in-depth analysis of questions surrounding such choice programs. For instance, analysts may want to consider the inflows of transfer students to certain schools relative to the size of their actual enrollment to determine the proportion of students in these schools who are supported by tax-funded choice programs and, thus, the degree to which specific private schools are reliant on public funds. Similarly, further research might consider the popularity of schools relative to their actual academic performance, socio-economic needs, or educational underperformance in the surrounding communities.
References
Abdulkadiroglu, A., Pathak, P. A., Schellenberg, J., & Walters, C. R. (2017). Do Parents Value School Effectiveness? (23912). https://doi.org/10.3386/W23912
Canbolat, Y. (2021). The long-term effect of competition on public school achievement: Evidence from the indiana choice scholarship program. Education Policy Analysis Archives, 29(97). https://doi.org/10.14507/EPAA.29.6311
Chubb, J. E., & Moe, T. M. (1990). Politics, markets, and America’s schools. Brookings Institution. https://iucat.iu.edu/catalog/4173422
Fuentes-Rohwer, C. (2019). The threat to Indiana’s public schools, and why it matters. In Blog. Indiana Coalition for Public Education. https://www.icpe-monroecounty.org/blog/the-threat-to-indianas-public-schools-and-why-it-matters
Lubienski, C., Perry, L. B., Kim, J., & Canbolat, Y. (2022). Market models and segregation: examining mechanisms of student sorting. Comparative Education, 58(1), 16–36. https://doi.org/10.1080/03050068.2021.2013043
Ravitch, D. (2021, January 14). The Dark History of School Choice. The New York Review. https://www.nybooks.com/articles/2021/01/14/the-dark-history-of-school-choice/