

Changes in Student Enrollment in Indiana Public School Corporations, 2006-2022 and 2021-2022 to 2022-2023
Authors
Dr. Michele Moore, Moaaz Hamid, Dr. Christopher Lubienski
Center for Evaluation and Education Policy, Indiana University
Key Takeaways
- Trends indicate that there are winners and losers when it comes to enrollment changes.
- Part of the reason for changing enrollment is the institutional environment that allows student transfers and competition introduced by school choice reforms.
- Online schools appear to have been significant in boosting enrollment of school corporations, but any causal claim needs further inquiry.
Indiana has undergone significant education policy changes in the last two decades, with a focus on accountability, expanding school choice options, improving teacher evaluation systems, and emphasizing college and career readiness. These changes have transformed the competitive environment in which schools and school corporations operate, impacting schools’ and school corporations’ enrollment. Enrollment trends reflect such changes and provide an opportunity to explore and understand these factors and their impacts.
This report examines the trends in student enrollment in Indiana School corporations/districts as reported by the Indiana Department of Education. The enrollment trends are analyzed over a 16-year period, 2006-2022, as well as the change over the most recent academic year for which data are available, 2022-2023. Fall Average Daily Membership (ADM) counts were used in this analysis. The patterns identified in this report demonstrate a story of “winners” and “losers” in Indiana’s efforts to create a competitive education landscape.
Historical Trends in Indiana
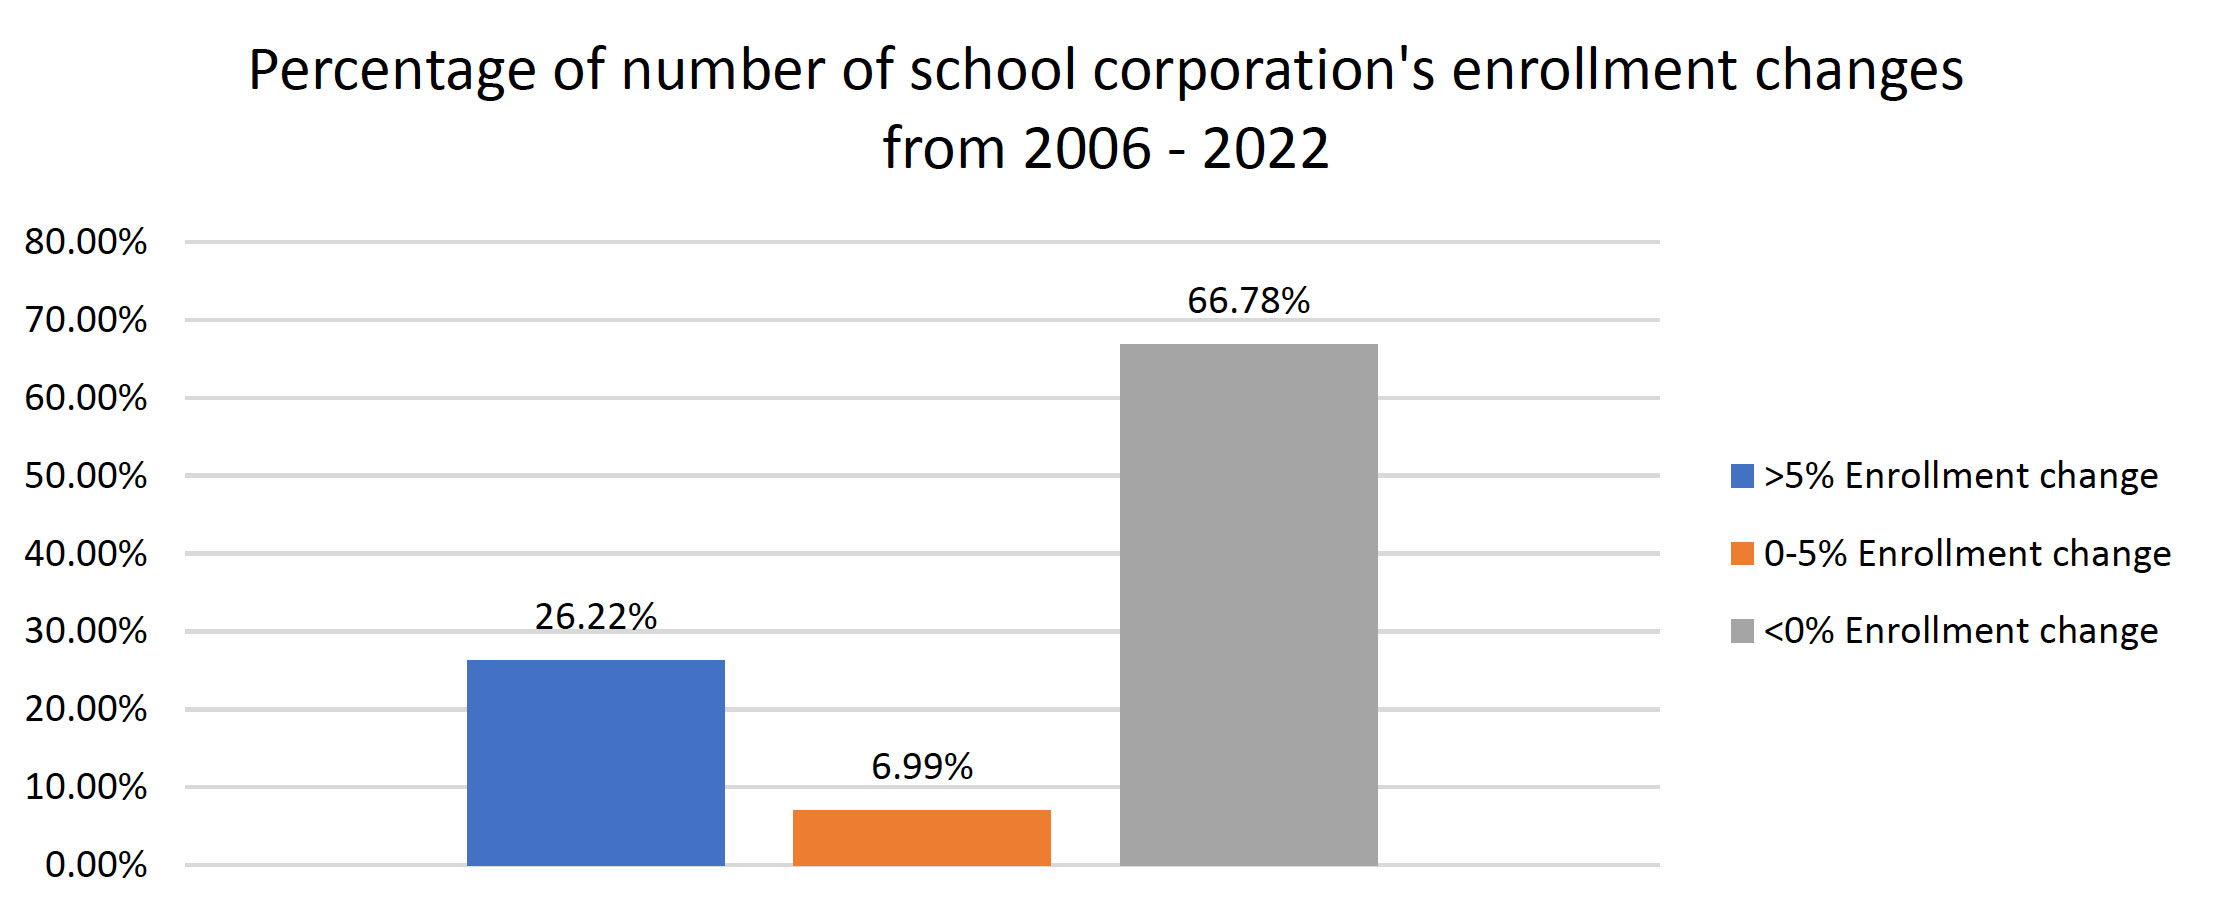
The 286 school corporations whose data are presented were chosen based on the availability of enrollment data. Overall enrollment changes presented in Figure 1 below are for the period of 2006-2022, revealing that about 75 (26%) school corporations experienced an enrollment growth of 5% or more. 20 school corporations (7%) experienced a growth of 5% or less, and 191 school corporations (67%) experienced a loss in enrollment. Table 1 below presents the 25 school corporations with the largest enrollment growth. Interestingly, 14 of the 25 school corporations with the highest enrollment growth are from the Indianapolis metropolitan area.
| Corp Name | Change in Enrollment 2006-2022 (N) |
| Hamilton Southeastern Schools* | 7,381 |
| Union School Corporation | 6,762 |
| Westfield-Washington Schools* | 3,935 |
| Brownsburg Community School Corp* | 3,446 |
| Franklin Township Com Sch Corp* | 3,394 |
| Avon Community School Corp* | 3,299 |
| Zionsville Community Schools* | 3,086 |
| Noblesville Schools* | 2,803 |
| Tippecanoe School Corp | 2,604 |
| Clarksville Community School Corp | 2,524 |
| Perry Township Schools* | 2,383 |
| Northwest Allen County Schools | 2,330 |
| Crown Point Community School Corp | 2,298 |
| Center Grove Community School Corp* | 2,278 |
| M S D Wayne Township* | 1,808 |
| Carmel Clay Schools* | 1,705 |
| Clark-Pleasant Community Sch Corp* | 1,655 |
| Plainfield Community School Corp* | 1,626 |
| M S D Southwest Allen County Schls | 1,478 |
| Seymour Community Schools | 1,382 |
| Mt Vernon Community School Corp* | 1,374 |
| North Central Parke Comm Schl Corp | 1,194 |
| Hanover Community School Corp | 1,038 |
| Penn-Harris-Madison School Corp | 952 |
| Bartholomew Con School Corp | 909 |
| Note: *Indianapolis Metropolitan Area school corporation. | |
Table 2 presents the percentage enrollment growth of 25 school corporations whose numbers were presented above. Seven school corporations experienced a growth rate of more than 50%, while the remaining were between 23% and 50%. The two school corporations experiencing the largest percentage growth started online schools that opened between 2018 and 2021. Figure 2 shows the trends in enrollment numbers from 2006 – 2022, which shows that while enrollment in in-person schools within the two school corporations remains approximately constant, the total enrollment gains are from enrollment spikes in online schools post-2018 (i.e., 6795 – 7131 – Indiana Digital Jr and High School, 6795 – 7142 – Indiana Digital Alternative School, 6795 – 7122 – Indiana Digital Elementary, and 1000 – 1007 – Indiana Gateway Digital Academy).
To reinforce the significance of online schools in these enrollment spikes, it is noteworthy that Union School Corporation, with the highest enrollment increase, has three online schools, two starting in 2019 and one in 2020. Whereas Clarksville Com School Corporation, with the second highest enrollment increase, has only one online school that started in 2022. It is also important to highlight the huge enrollment gap (1252.66%) between the two school corporations with the highest enrollment gains that can be attributed to the number of online schools and their duration of operations. The availability of state-wide data on online schools might also reveal other interesting trends. However, here, it is evident that online schools have played a significant role in boosting enrollment for the two school corporations, whose enrollment gains are markedly higher than gains observed in all other school corporations.
| Corp Name | Change in Enrollment (%) 2006-2022 |
| Union School Corporation | 1420.59 |
| Clarksville Com School Corp | 167.93 |
| Westfield-Washington Schools* | 75.02 |
| Zionsville Community Schools* | 64.02 |
| Hanover Community School Corp | 61.20 |
| Hamilton Southeastern Schools* | 51.87 |
| Daleville Community Schools | 51.26 |
| Brownsburg Community Sch Corp* | 51.23 |
| Avon Community School Corp* | 45.55 |
| Franklin Township Com Sch Corp* | 43.41 |
| Northwest Allen County Schools | 39.80 |
| Plainfield Community Sch Corp* | 39.41 |
| Mt Vernon Community Sch Corp* | 39.24 |
| Lawrenceburg Com School Corp | 36.60 |
| Barr-Reeve Com Schools Inc | 36.56 |
| Clark-Pleasant Com School Corp* | 36.54 |
| Noblesville Schools* | 36.05 |
| Seymour Community Schools | 34.89 |
| Crown Point Community Sch Corp | 33.96 |
| Center Grove Com Sch Corp* | 31.38 |
| Whiting School City | 29.65 |
| Frankton-Lapel Community Schs | 29.34 |
| Eastern Howard School Corp | 25.40 |
| Tippecanoe School Corp | 23.65 |
| M S D Southwest Allen County | 23.18 |
| Note: *Indianapolis Metropolitan Corporation. | |
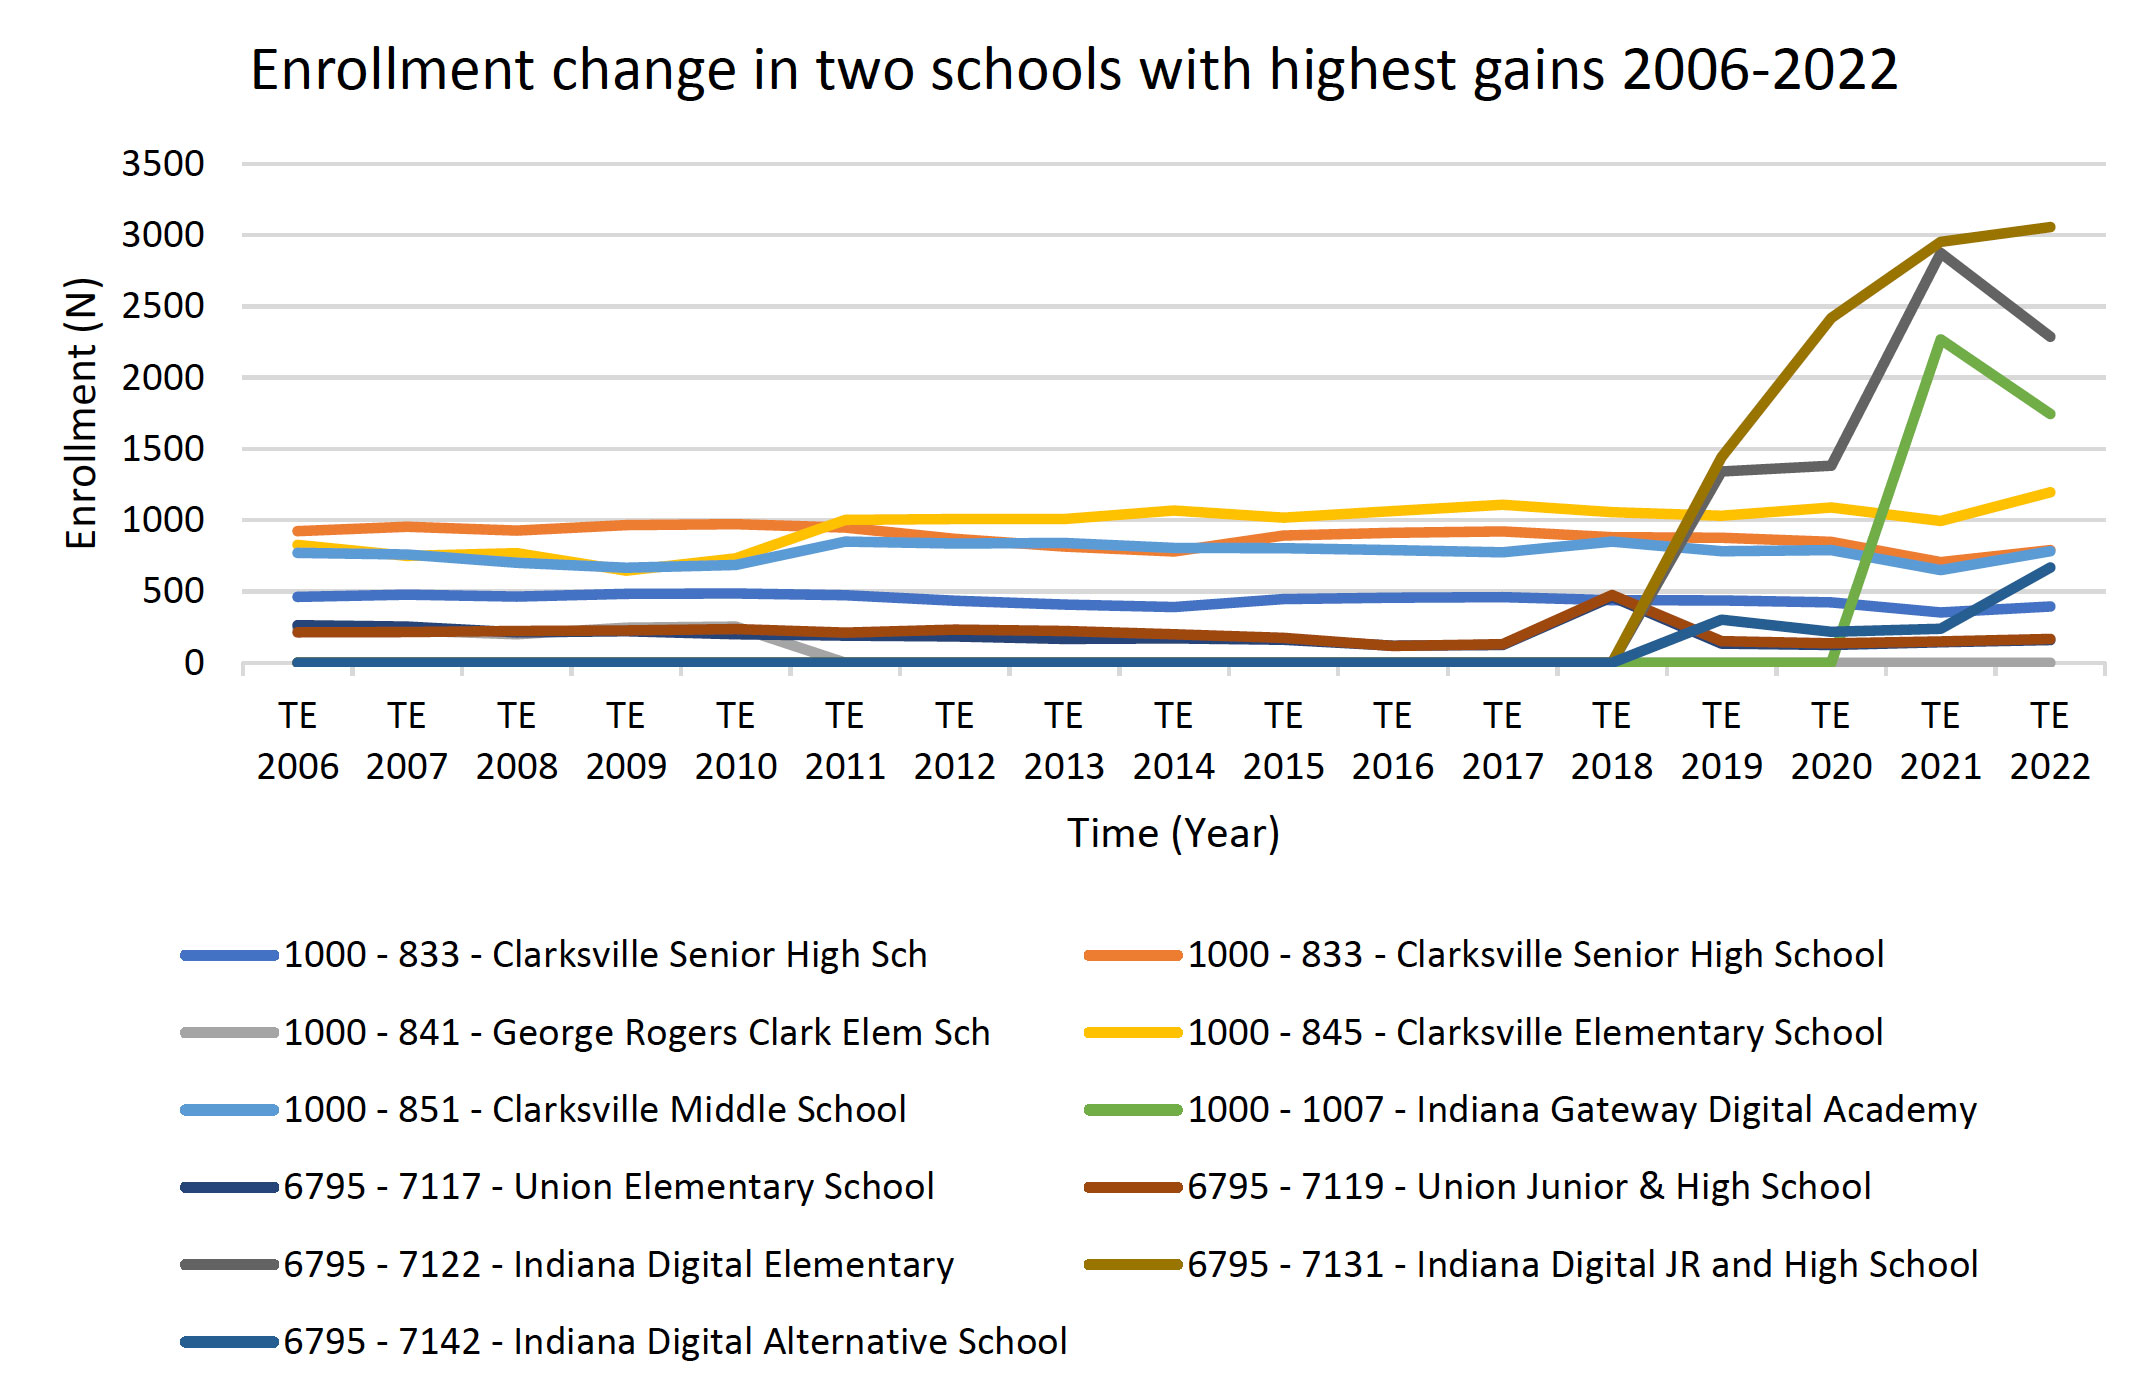
Table 3 presents the 20 school corporations with the largest reduction in enrollment numbers, with ten school corporations losing more than 2000 students and ten school corporations losing less than 2000 students. While these numbers do not seem high, when looking at the proportion of reduction in student enrollment in Table 4, we can see that 44 school corporations lost from a quarter to about three-quarters of their enrollment in these 16 years.
| Corp Name | Change in Enrollment (N) 2006-2022 |
| 1. Indianapolis Public Schools | -15,527 |
| 2. Gary Community School Corp | -11,041 |
| 3. South Bend Community Sch Corp | -6,417 |
| 4. Anderson Community School Corp | -3,824 |
| 5. School City of Hammond | -3,123 |
| 6. Fort Wayne Community Schools | -2,729 |
| 7. School City of East Chicago | -2,668 |
| 8. Vigo County School Corp | -2,633 |
| 9. Muncie Community Schools | -2,487 |
| 10. Elkhart Community Schools | -2,171 |
| 11. Kokomo-Center Twp Con Sch Corp | -1,789 |
| 12. North Lawrence Com Schools | -1,738 |
| 13. Marion Community Schools | -1,665 |
| 14. Portage Township Schools | -1,646 |
| 15. Michigan City Area Schools | -1,633 |
| 16. M S D Martinsville Schools | -1,531 |
| 17. Huntington Co Com Sch Corp | -1,461 |
| 18. Jennings County Schools | -1,408 |
| 19. New Castle Community Sch Corp | -1,091 |
| 20. Franklin County Com Sch Corp | -1,068 |
| Corp Name | Change in Enrollment (%) 2006-2022 |
| Gary Community School Corp | -73.03% |
| Northeast School Corp | -48.53% |
| Hamilton Community Schools | -46.59% |
| Eminence Community School Corp | -44.46% |
| School City of East Chicago | -44.34% |
| Attica Consolidated Sch Corp | -42.89% |
| Indianapolis Public Schools | -41.35% |
| Whitko Community School Corp | -39.17% |
| Anderson Community School Corp | -38.16% |
| North Miami Community Schools | -36.89% |
| North Judson-San Pierre Sch Corp | -36.32% |
| Western Wayne Schools | -36.30% |
| Blackford County Schools | -34.88% |
| South Dearborn Com School Corp | -34.51% |
| Franklin County Com Sch Corp | -34.26% |
| Muncie Community Schools | -32.87% |
| North Lawrence Com Schools | -32.20% |
| North Newton School Corp | -32.01% |
| Marion Community Schools | -31.02% |
| East Gibson School Corporation | -30.81% |
| Loogootee Community Sch Corp | -30.36% |
| Oregon-Davis School Corp | -30.04% |
| Medora Community School Corp | -29.77% |
| West Central School Corp | -29.47% |
| South Bend Community Sch Corp | -29.35% |
| North Putnam Community Schools | -29.35% |
| Lakeland School Corporation | -28.44% |
| Lake Ridge Schools | -28.19% |
| Spencer-Owen Community Schools | -27.99% |
| North Adams Community Schools | -27.84% |
| M S D Martinsville Schools | -27.42% |
| Brown County School Corporation | -27.24% |
| New Castle Community Sch Corp | -27.07% |
| Culver Community Schools Corp | -27.02% |
| Jennings County Schools | -26.58% |
| Griffith Public Schools | -26.56% |
| Mitchell Community Schools | -26.48% |
| M S D Shakamak Schools | -26.34% |
| Rush County Schools | -26.11% |
| Crawford Co Com School Corp | -26.07% |
| Southeast Fountain School Corp | -25.53% |
| Kokomo-Center Twp Con Sch Corp | -25.46% |
| Pike County School Corp | -25.44% |
| Crothersville Community Schools | -25.00% |
Table 5. presents 15 school corporations that lost both the highest numbers of students and the percentage of students in the past 16 years.
| Corp Name | Change in Enrollment 2006-2022 | |
| N | % | |
| Indianapolis Public Schools | -15,527 | -41.35% |
| Gary Community School Corp | -11,041 | -73.03% |
| South Bend Community Sch Corp | -6,417 | -29.35% |
| Anderson Community School Corp | -3,824 | -38.16% |
| School City of East Chicago | -2,668 | -44.34% |
| Muncie Community Schools | -2,487 | -32.87% |
| Kokomo-Center Twp Con Sch Corp | -1,789 | 25.46% |
| North Lawrence Com Schools | -1,738 | -32.20% |
| Marion Community Schools | -1,665 | -31.02% |
| M S D Martinsville Schools | -1,531 | -27.42% |
| Jennings County Schools | -1,408 | -26.58% |
| New Castle Community Sch Corp | -1,091 | -27.07% |
| Franklin County Com Sch Corp | -1,068 | -34.26% |
| South Dearborn Com School Corp | -1,036 | -34.51% |
| Spencer-Owen Community Schools | -870 | 27.99% |
ADM Trends 2022-2023
While the long-term trends in enrollment are important in revealing patterns over time, yearly shifts in enrollments are important in revealing short-term trends and shifts. This becomes particularly important during unprecedented changes, such as the COVID-19 pandemic. As some semblance of normalcy returns, we are left with changes in enrollment that may have significant long-term and short-term impacts on budgets and the viability of local public schools. Overall, 133 corporations increased enrollment during this period, and 155 school corporations lost enrollment from last year. The enrollment trends in Indiana school corporations presented below reveal ADM trends from 2022-2023.
Table 6 presents the top 20 school corporations based on their net ADM increase from 2021-22 to 2022-23. There is a marked difference between the enrollment increase in the top two school corporations, which see gains significantly greater than the increases in the remainder of the school corporations. It is noteworthy that these are the two school corporations that have experienced the highest enrollment increase during the past 16 years as well and have a significant proportion of online schools. See Figure 2 for longitudinal trends in school enrollment shifts within these two school corporations.
| School Corp | Net ADM Increase (N) from 2021-22 to 2022-23 |
| Clarksville Community School Corp | 2685 |
| Union School Corporation | 900 |
| Brownsburg Community School Corp* | 373 |
| Center Grove Community School Corp* | 364 |
| Westfield-Washington Schools* | 360 |
| Madison-Grant United School Corp | 299 |
| Cloverdale Community Schools | 280 |
| Crown Point Community School Corp | 243 |
| Avon Community School Corp* | 232 |
| Northwest Allen County Schools | 229 |
| MSD Lawrence Township* | 167 |
| Mt Vernon Community School Corp* | 151 |
| Silver Creek School Corporation | 151 |
| MSD Wabash County Schools | 141 |
| Lebanon Community School Corp* | 135 |
| Zionsville Community Schools* | 122 |
| Hanover Community School Corp | 119 |
| Concord Community Schools | 113 |
| Southern Hancock Co Com Sch Corp* | 107 |
| Southwest School Corporation | 93 |
| Note: *Indianapolis Metropolitan Corporation. | |
Table 7 presents the top 22 school corporations by the percentage of enrollment increase. The top six school corporations experienced a greater than 10% increase in enrollment, with the top school corporation having a 200% percent increase in enrollment, followed by gains of 30.43% and 23.69%, respectively. The remaining 16 school corporations experienced enrollment increases ranging from 4% to 9%.
| School Corp | Increase in ADM 2021-22 to 2022-23 (%) |
| Clarksville Community School Corp | 200.07 |
| Medora Community School Corp | 30.43 |
| Madison-Grant United School Corp | 23.69 |
| Cloverdale Community Schools | 19.91 |
| Union School Corporation | 14.20 |
| Caston School Corporation | 12.08 |
| MSD of New Durham Township | 8.13 |
| Milan Community Schools | 7.42 |
| West Washington School Corp | 7.11 |
| Argos Community Schools | 6.82 |
| MSD Wabash County Schools | 6.64 |
| Southwestern Con Sch Shelby Co | 6.38 |
| South Henry School Corp | 6.21 |
| Southwest School Corporation | 5.64 |
| Southern Wells Com Schools | 5.21 |
| Silver Creek School Corporation | 5.05 |
| Scott County School District 1 | 5.02 |
| Hanover Community School Corp | 4.55 |
| Eastern Howard School Corporation | 4.34 |
| MSD Boone Township | 4.18 |
| Shelby Eastern Schools | 4.12 |
| Westfield-Washington Schools | 4.08 |
Table 8 presents the school corporations that experienced a decrease in enrollment from 2021-2022 to the 2022-23 School Year. These 20 school corporations experienced the highest enrollment losses, with the top seven school corporations losing 300 or more students, while the remaining 13 school corporations experienced enrollment losses ranging from 134 to 296 students.
| School Corp | Net Decrease (N) from 2021-22 to 2022-23 in ADM |
| South Bend Community School Corp | -521 |
| School City of Hammond | -452 |
| Clark-Pleasant Community Sch Corp | -440 |
| MSD Washington Township | -390 |
| Perry Township Schools | -380 |
| Elkhart Community Schools | -340 |
| New Albany-Floyd Co Con Sch | -300 |
| Gary Community School Corp | -296 |
| Anderson Community School Corp | -274 |
| MSD Wayne Township | -257 |
| MSD Pike Township | -244 |
| North Lawrence Com Schools | -227 |
| Portage Township Schools | -219 |
| Evansville Vanderburgh School Corp | -202 |
| Fort Wayne Community Schools | -165 |
| Penn-Harris-Madison School Corp | -153 |
| Vigo County School Corp | -153 |
| School City of Mishawaka | -146 |
| Carmel Clay Schools | -143 |
| Jennings County School Corporation | -134 |
Table 9 below presents the top 20 school corporations based on percentage enrollment losses during the 2021-22 to 2022-23 school year. The top two school corporations experienced an enrollment loss of more than 10%. The proceeding seven school corporations experienced an enrollment loss between 5% and 9%, whereas the remaining 11 experienced an enrollment loss ranging from about 4% to 5%.
| School Corp | Net Decrease 2021-22 to 2022-23 (%) |
| Attica Consolidated School Corp | -12.01% |
| North Miami Community Schools | -10.26% |
| Crothersville Community Schools | -8.51% |
| Cannelton City Schools | -8.37% |
| Gary Community School Corp | -6.77% |
| Clark-Pleasant Community Sch Corp | -6.46% |
| Peru Community Schools | -6.36% |
| Western Wayne Schools | -6.24% |
| White River Valley School District | -6.17% |
| North Lawrence Com Schools | -5.84% |
| Smith-Green Community Schools | -4.95% |
| East Washington School Corp | -4.94% |
| School City of Whiting | -4.84% |
| Northeast Dubois Co Sch Corp | -4.79% |
| North Newton School Corp | -4.79% |
| Delphi Community School Corp | -4.76% |
| Rochester Community School Corp | -4.61% |
| Lakeland School Corporation | -4.58% |
| Anderson Community School Corp | -4.23% |
| Pioneer Regional School Corp | -4.08% |
School Corporations with less than 1,000 Students
At the legislative level, there has been much discussion about the substantial number of school corporations with small student populations. Currently, there are 54 school corporations with less than 1,000 students. All but seven of those school corporations lost student enrollment from 2006-2022. Table 10 presents the change in ADM in numbers and percentages of these 54 school corporations over the past 16 years, from 2006 to 2022. All these school corporations, except seven, experienced a loss in enrollment over the past 16 years.
| School Corporation | 2022-23 ADM (N) | 2006 ADM (N) | Change in ADM (N) | Change in ADM as a Percent of Total Enrollment (%) |
| Southeast Fountain School Corp | 989 | 1,328 | -339 | -25.53 |
| Fremont Community Schools | 985 | 1,206 | -221 | -18.33 |
| Flat Rock-Hawcreek School Corp | 972 | 1,147 | -175 | -15.26 |
| Rossville Con School District | 960 | 1,006 | -46 | -4.57 |
| South Central Com School Corp | 950 | 849 | 101 | 11.90 |
| Triton School Corporation | 946 | 1,116 | -170 | -15.23 |
| M S D of New Durham Township | 944 | 830 | 114 | 13.73 |
| Pioneer Regional School Corp | 941 | 1,048 | -107 | -10.21 |
| West Washington School Corp | 934 | 1020 | -86 | -8.43 |
| North Judson-San Pierre Sch Corp | 931 | 1462 | -531 | -36.32 |
| Randolph Eastern School Corp | 928 | 1055 | -127 | -12.04 |
| Orleans Community Schools | 908 | 847 | 61 | 7.20 |
| North White School Corp | 900 | 1055 | -155 | -14.69 |
| Southern Wells Com Schools | 889 | 821 | 68 | 8.28 |
| Covington Community School Corp | 888 | 991 | -103 | -10.39 |
| Clinton Central School Corporation | 867 | 1098 | -231 | -21.04 |
| South Newton School Corp | 862 | 969 | -107 | -11.04 |
| Wes-Del Community Schools | 861 | 880 | -19 | -2.16 |
| Bloomfield School District | 858 | 1112 | -254 | -22.84 |
| Culver Community Schools Corp | 840 | 1151 | -311 | -27.02 |
| Edinburgh Community School Corp | 838 | 895 | -57 | -6.37 |
| Springs Valley Com School Corp | 837 | 980 | -143 | -14.59 |
| Caston School Corporation | 835 | 833 | 2 | 0.24 |
| Northeast Dubois Co Sch Corp | 834 | 964 | -130 | -13.49 |
| Rising Sun-Ohio Co Com | 825 | 980 | -155 | -15.82 |
| Cowan Community School Corp | 791 | 651 | 140 | 21.51 |
| Tri-Central Community Schools | 787 | 1046 | -259 | -24.76 |
| Jac-Cen-Del Community Sch Corp | 773 | 968 | -195 | -20.14 |
| Northeast School Corp | 770 | 1496 | -726 | -48.53 |
| North Miami Community Schools | 770 | 1220 | -450 | -36.89 |
| Tri-County School Corporation | 765 | 813 | -48 | -5.90 |
| South Henry School Corp | 753 | 818 | -65 | -7.95 |
| Western Wayne Schools | 751 | 1179 | -428 | -36.30 |
| Loogootee Community Sch Corp | 750 | 1077 | -327 | -30.36 |
| White River Valley School District | 745 | 901 | -156 | -17.31 |
| Lanesville Community School Corp | 744 | 654 | 90 | 13.76 |
| East Gibson School Corporation | 721 | 1042 | -321 | -30.81 |
| Argos Community Schools | 689 | 703 | -14 | -1.99 |
| M S D Shakamak Schools | 674 | 915 | -241 | -26.34 |
| North Vermillion Com Sch Corp | 673 | 826 | -153 | -18.52 |
| Frontier School Corporation | 671 | 831 | -160 | -19.25 |
| Shoals Community School Corp | 669 | 714 | -45 | -6.30 |
| Blue River Valley Schools | 642 | 832 | -190 | -22.84 |
| West Central School Corp | 639 | 906 | -267 | -29.47 |
| Southwestern Con Sch Shelby Co | 634 | 744 | -110 | -14.78 |
| Attica Consolidated School Corp | 542 | 949 | -407 | -42.89 |
| Randolph Southern School Corp | 522 | 655 | -133 | -20.31 |
| Oregon-Davis School Corp | 496 | 709 | -213 | -30.04 |
| Crothersville Community Schools | 441 | 588 | -147 | -25.00 |
| Hamilton Community Schools | 352 | 659 | -307 | -46.59 |
| Tri-Township Cons School Corp | 337 | 395 | -58 | -14.68 |
| Eminence Community School Corp | 306 | 551 | -245 | -44.46 |
| Cannelton City Schools | 219 | 249 | -30 | -12.05 |
| Medora Community School Corp | 210 | 299 | -89 | -29.77 |
In theory, students should generally be transferred to more effective schools (Walberg & Bast, 2003), although it is not clear from these data that this is always the case.
These data show several trends indicating that many Indiana schools are experiencing significant enrollment instability. In some respects, this is to be expected, as policymakers have laid the legislative groundwork for a system in which public school corporations, charter school organizations, and even private schools could poach students from each other as they are incentivized to improve, innovate, or market themselves, or otherwise face severe if not fatal financial repercussions. However, given mounting evidence, transferring students is often not moving to more effective alternatives, and these policies overall may be increasing forms of student sorting (Abdulkadiroglu et al., 2017; Bifulco & Ladd, 2007; Lubienski et al., 2022). Parents, policymakers, and voters should also consider the relative costs of these policies that create winners and losers in the education marketplace.
References
Abdulkadiroglu, A., Pathak, P. A., Schellenberg, J., & Walters, C. R. (2017). Do Parents Value School Effectiveness? (23912). https://doi.org/10.3386/W23912
Bifulco, R., & Ladd, H. F. (2007). School choice, racial segregation, and test-score gaps: Evidence from North Carolina’s charter school program*. Journal of Policy Analysis and Management, 26(1), 31–56. https://doi.org/10.1002/PAM.20226
Lubienski, C., Perry, L. B., Kim, J., & Canbolat, Y. (2022). Market models and segregation: examining mechanisms of student sorting. Comparative Education, 58(1), 16–36. https://doi.org/10.1080/03050068.2021.2013043
Walberg, H. J., & Bast, J. L. (Joseph L. (2003). Education and capitalism : how overcoming our fear of markets and economics can improve America’s schools. Hoover Institution Press.