

Mis-Shaping the Teaching Force: An Analysis of Passing Rates of Indiana's Teacher Candidates
Authors
Alexander Cuenca, Ph.D.
Indiana University
Executive Summary
- Since their inception, teacher licensure exams have been used — sometimes explicitly — to suppress Black teachers and their salaries and prevent the integration of school districts.
- Analyses reveal large disparities in pass rates of White teacher candidates and candidates of color. These passing rate gaps disproportionately winnow the prospective pool of teachers of color.
- The panels that help construct and validate teacher licensure exams in Indiana reveals majority White subject-matter experts.
- Thus, rather than “objective” measures of prospective teacher quality, these exams are keeping Black and Hispanic educators out of the teaching profession.
- Ignoring the adverse effects of teacher licensure exams on candidates of color undercuts efforts to expand the number of teachers and create a more diverse workforce in Indiana.
Schools are experiencing a severe shortage of teachers. This is true not only in terms of total numbers, but also in terms of classroom teachers who are racial and ethnic minorities. And research shows that the lack of teachers of color has detrimental impacts for students, and especially for students of color.
This report examines the perpetual problem of diversifying the teacher workforce in Indiana by examining how teacher licensure exams act as an undue obstacle for candidates of color seeking to enter the profession. Teacher licensure exams serve a gatekeeping function that ostensibly ensures the quality of the teacher workforce. However, analyses of teacher licensure data reveal large score gaps between candidates of color and their White counterparts. In this report, the racial origins of teacher licensure exams offer context for contemporary score gaps, in turn allowing other questions to surface, such as: What purposes are served by teacher licensure exams? How are teacher licensure exams constructed? Who determines the validity of teacher licensure exams?
The first section of this report briefly examines the history of teacher licensure examinations in the US. The National Teacher Examination (NTE) was intentionally used to displace Black teachers, yet in 1978, the U.S. Supreme Court ignored these adverse effects and upheld the validity of the NTE. Today, the direct successor of the NTE is in use in Indiana and continues to have the same adverse effects on the Black and Hispanic teacher workforce.
The second section of this report details first-time passing rates on Indiana’s teacher licensure exams between 2016 and 2021, finding:
- White teacher candidates passed subtests at significantly higher rates than Black or Hispanic candidates, with the largest gap being in mathematics.
- Black candidates scored between 18 and 17 percent points lower than White candidates on the pedagogy exam.
- Of the nine subject areas exams studied, non-White candidates matched or surpassed White passing rates only twice
- White candidates otherwise consistently outperformed Black and Hispanic candidates, by gaps up to 52 percentage points.
Rather than a clear reflection of the abilities of Black and Hispanic candidates, when framed historically these data indicate the exams continue to have adverse effects on the Black teacher workforce. This points to questions about the systems that sustain these adverse effects.
The third section of this report considers this question by examining how teacher licensure exams are constructed and validated. The psychometric method typically used to validate these exams as germane to the profession of teaching creates panels of subject-matter experts to determine how a “just qualified candidate” might answer items on a given test. These judgements are used to adopt the passing score for teacher licensure exams.
That approach has at least three flaws: 1) panelists often struggle with key analytical concepts, 2) there are disparities in the ways judges rate unfamiliar items, 3) unconscious bias influences how judges determine “just qualified candidates.” With these problems in mind, this analysis revealed:
- Panels of Indiana education stakeholders that determine cut scores were 92% White; 2% Black; 2% Hispanic, according to available data.
- Despite the ability to draw from across the country, 4 of 10 panels did not include a single Black subject matter expert, and half did not include a Hispanic expert. In one exam, all subject matter experts were White.
Thus, teacher licensure exams are constructed and validated by an overwhelming White set of subject matter experts. Given research of the benefits of demographically diverse decision-making groups, teacher licensure exams exist in a closed ecosystem — one that adversely affects prospective teachers of color.
Recommendations:
The following recommendations are offered to help break this self-reinforcing ecosystem to help diversify the teacher workforce in Indiana:
Diversify Standard Setting Panels. Because demographic diversity is an important feature of any high stakes decision-making group, legislators and state education agencies should require vendors to utilize diverse panels.
Recognize the Individual Costs of Taking Licensure Exams. In view of the financial barrier of licensure exams, scholarships could help candidates from under-represented groups to retake licensure exams.
Increase Recruitment of Candidates of Color. Greater investment is needed for teachers of color in (1) scholarships for reputable teacher preparation programs; (2) loan forgiveness for tuition of teacher candidates of color in exchange for a commitment to teach in Indiana; and (3) recruiting and supporting more students of color to attend education schools.
Create Systems to Support Candidates of Color. Education schools should create programs and collectives that help these candidates work together to achieve mastery on licensure exams.
Establish GPA/Licensure Exams Flexibility Rules. As in other states, Indiana policymakers should establish flexibility rules that adjust passing scores based on the GPA of a particular candidate.
Research Demographics in Standard-Setting Studies. More empirical attention must be given to the effects of race on the decision-making of teacher licensure standard setting panelists.
Learn From the Research on Minority Serving Teacher Education Programs. In addition to finding innovative recruitment and retention strategies, teacher education programs should adopt effective practices identified in research on teacher education programs at Minority Serving Institutions (MSIs).
The closed loop of teacher licensure exams continues to have adverse effects on the career trajectories of teacher candidates of color, on students of color, and on White students as well. A century after this flawed system of teacher licensure was first implemented, policymakers should consider these recommendations, not only for the sake of individual teacher candidates, but to grow a more representative and effective teacher corps.
Brown is Not Ancient History
Brown vs. Board of Education, as Leslie Fenwick argues in her book, Jim Crow’s Pink Slip: The Untold Story of Black Principal and Teacher Leadership, is not ancient history. Despite the fact that the Brown decision was made in 1954, true desegregation did not occur in many communities until the 1980s. In Boston, for example, it was only 1987 when a federal appeals court ruled that Boston Public Schools had successfully met the requirements laid out by Brown. Similarly, in St. Louis, the Voluntary Interdistrict Choice Corporation program that was implemented in 1981 to reduce racial segregation closed in 2018. Thus, the reconfiguration of the composition of the teacher workforce in the United States continues to be a work in progress in the twenty-first century, as Black and Hispanic educators and prospective educators continue to work against varying degrees of implicit and explicit White resistance. Based on this history, the teacher workforce today fails to reflect the racial and ethnic diversity of the nation. People of color in the United States represent nearly 40% of the population and 50% of students, while the teaching profession continues to be approximately 80% White. The demographic divide between teachers and students is often seen as the result of poor recruitment or retention efforts (Epstein, 2005; Ingersoll & May, 2011; Darling-Hammond, 2010). In other words, if educator preparation programs and school districts were able to develop strategies and policies to attract and keep candidates of color, the demographic differences between teachers and students would diminish. The focus on retention and recruitment has produced a number of promising practices such as the development of teacher residency, grow your own, and mentoring programs that encourage more people of color into the teaching profession. However, as Epstein (2005) argues, in order to formulate an effective response to the current composition of the teaching force, we must consider it a case of institutional racism, not merely a problem of recruitment and retention. This report recognizes that Brown is not ancient history and that White resistance to the certification of non-White educators has been codified implicitly and explicitly in ways that continue to affect the demographic composition of the teacher workforce in the United States. Licensure exams are an important gatekeeping tool to help ensure public trust in the professionalism of teachers. However, licensure exams have also been used as gatekeeping tools to decimate the Black teacher workforce (Fenwick, 2022; Baker, 1995). This history is undeniable, and its long shadow continues to have systemic effects on the ability of Black and Hispanic teachers to work as certified classroom teachers. As such, this report examines how the teacher licensure exams are constructed in Indiana; the demographic representation that exists when these licensure exams are constructed; and the impact of these certification exams on the demographic composition of the teacher workforce.
A Brief History of Teacher Examinations
Since the emergence of common school movement in the United States in the mid-nineteenth century, the history of teacher certification has revolved around a central question: who will teach what to our children? As education in the United States became a public charge and the purpose of education expanded beyond basic literacy and religious indoctrination, government authorities, first at the local level and then at the state level, began to centralize the credentialing of educators. The earliest answers, to the question of who will teach what to our children, were posed by local school boards to prospective teachers, such as one candidate in Indiana who was asked by a school board member, “What is the product of 25 cents by 25 cents?” (Elsbree, 1939, p. 183). These examinations were generally private events, and thus, standards varied widely within and across states. Moreover, as private affairs, examinations were also used as a patronage system for local politicians.
| 1898 | 1911 | 1921 | 1926 | 1937 | |
| State systems (state issues all certificates) | 3 | 15 | 26 | 36 | 41 |
| State-controlled systems (state sets rules, conducts exams, county issues some certificates) | 1 | 2 | 7 | 4 | 3 |
| Semi-state systems (state sets rules, writes questions, county grades papers, issues certificates) | 17 | 18 | 10 | 5 | 1 |
| State-county systems (both issue certificates, county controls some certificates) | 18 | 7 | 3 | 2 | 2 |
| State local-system (full control by town committees) | 2 | 2 | 2 | 2 | 1 |
| Source: Benjamin Frazier, Development of State Programs for the Certification of Teachers, U.S. Office of Education, 1938 | |||||
Eventually, frustrations over varied standards and local favoritism led states to shift toward a centralized credentialing model for teachers (see Table A). The establishment of normal schools across the country—which served as training sites to prepare teachers for the classroom—further accelerated the credentialing model. By 1921, virtually every state recognized graduation from a normal school or a university as a qualification for certification. Some states, like California, recognized professional education as a substitute for examinations, while others, like Indiana, demanded professional education and examinations, which now included questions about pedagogy, management, and educational history (Sedlak, 2008).
By 1940, as a rapidly growing teacher workforce encountered inconsistent state certification requirements and standards, the National Teacher Examination (NTE), developed by Ben Wood, gained prominence. NTE was billed as an assessment that would help standardize the employment decisions of superintendents. The eight-hour examination was initially composed of eleven separate tests that assessed intellectual and communicative skills such as reasoning and comprehension; cultural and contemporary background such as history, fine arts, and literature; and professional information such as education and social policy, child development; and methods of teaching.
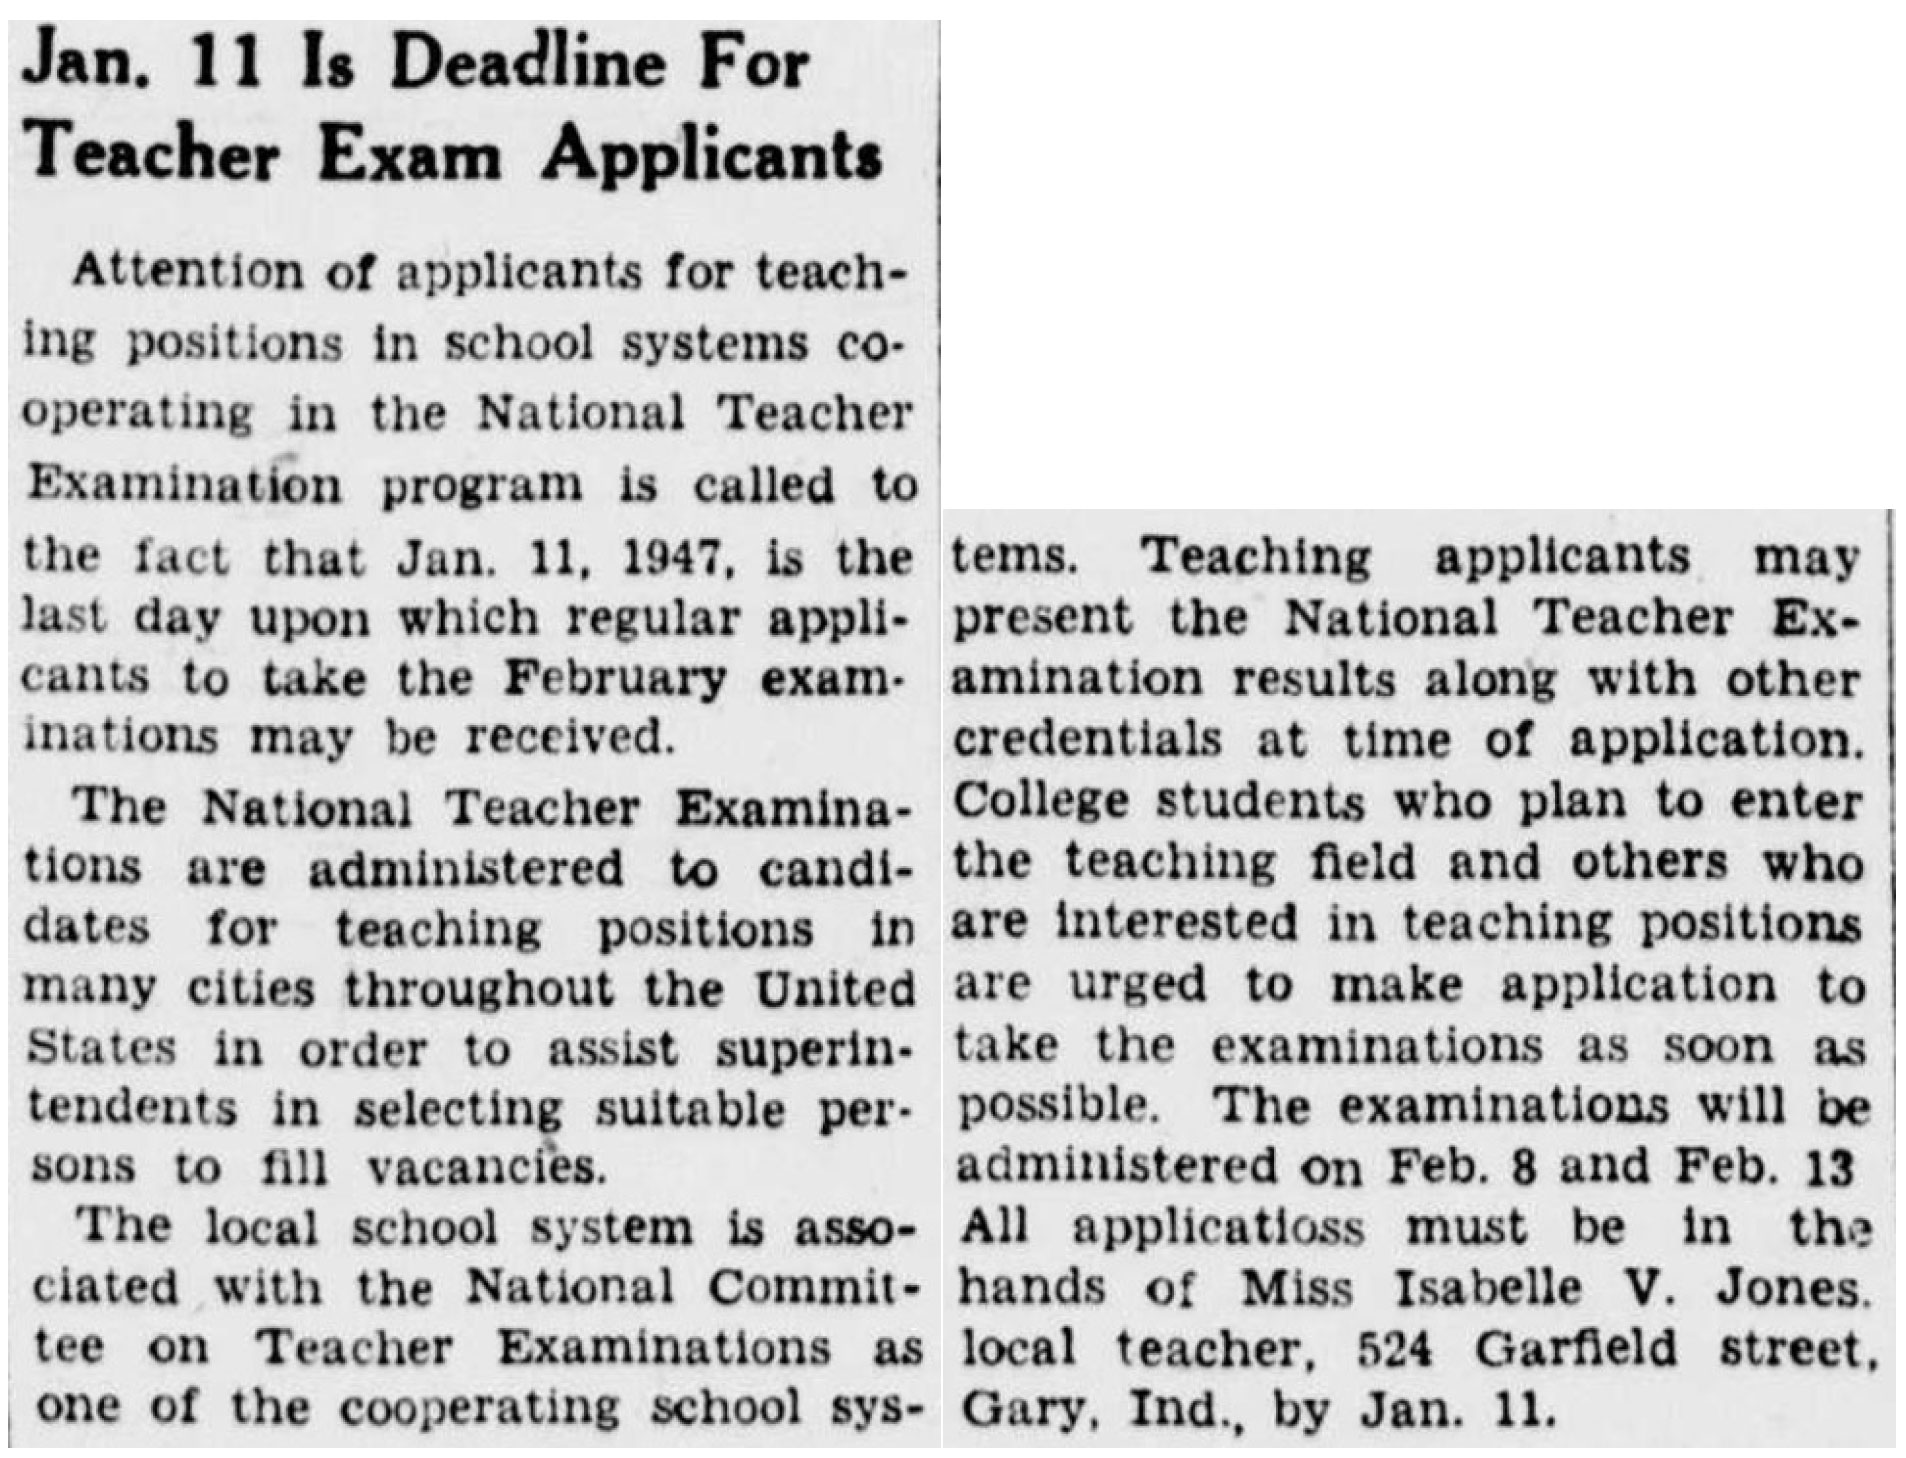
NTE was initially adopted by South Carolina as a way to justify how it determined its “graded” credentialing of teachers. Different grades determined different salary schedules. Prior to NTE, South Carolina and many other Southern states used a dual salary schedule system based on race that underpaid Black certified teachers. This system was outlawed by Alston v. City of Norfolk decision of the U.S. Supreme Court in 1940. However, Wood quickly realized the potential of NTE to help Southern states maintain a de facto dual salary system and organized conferences across the South where he reassured his audiences that Black teachers scored in the lower quintile and that NTE could be of “great assistance in working out a constructive solution to the problems brought to focus by the Norfolk decision” (Baker, 1995, p. 55). In other words, NTE provided an ostensibly “objective” way to determine how the state certified and paid its teachers.
In the following decades, numerous states and districts began to use NTE as a way to reproduce race-specific salary differentials (Fenwick, 2022). In the 1950s, NTE began to be administered by the Educational Testing Service (ETS), which continued to tinker with the scope and length of the examination as it continued to be adopted by more and more states based on its insidious capacity to depress the wages of Black teachers. In the wake of the Brown decision, NTE was not only used as a “punitive measure to justify the racial imbalance in hiring practices” (Fultz, 2004, p. 26) but also became a way to determine entry into the profession. States began to determine cutoff scores for teachers seeking certification and also required Black teachers that were previously certified to take the NTE in order to be considered for a position in a desegregating school district (Fultz 2004).
Despite repeated denunciations by the National Educational Association (NEA) of the NTE as a tool to avoid hiring Black teachers into newly integrated schools, ETS continued to defend the assessment as an “objective” measure of what a teacher should know. In 1970, the NEA joined the U.S. Department of Justice in court challenges that detailed how the assessment had a racially discriminatory effect on Black employment in public schools. These court challenges focused on the validity and validation of the assessment as a tool to determine job related expectations and performance.
In 1978, a 5-2 majority of the U.S. Supreme Court rejected an appeal by the U.S. Department of Justice and the NEA to have the NTE disqualified as an assessment to hire and classify teachers. U.S. Solicitor General Wade H. McCree shared in his brief that because of the NTE, South Carolina was able to disqualify 83 percent of Black applicants for teacher certificates, but only 17.5 percent of White applicants, leading to a 95 percent pool of White certified teachers. Despite these deleterious effects on the Black teacher workforce, the Supreme Court upheld the Federal District Court decision that the NTE “demonstrated to provide a useful measure of the extent to which prospective teachers have mastered the content of their teacher training programs.”
The National Teacher Examination could be of “great assistance in working out a constructive solution to the problems brought to focus by the Norfolk decision” – Ben Wood
ETS demonstrated content validity to the courts by asking 450 faculty members from higher education institutions in South Carolina to determine if the NTE fairly sampled the knowledge that higher education institutions sought to impart (McDaniel, 1978). Indeed, these panels provided "estimates of the percentages of minimally knowledgeable candidates who would be expected to know the answers to individual test questions.” This process of using panels to validate test items and set cut scores continues to be used today.
Throughout 1980s, NTE became the most widely used examination program to determine teacher licensure in the United States and continued to have disastrous effects on the Black teacher workforce. States experienced significant disparities between Black and White candidate NTE performance. For example, in Alabama, 51% of Black candidates failed the “early childhood” version of the NTE, while only 7% of White candidates failed. Similar statistics were found in Arkansas and North Carolina (Toch, 1983). In 1985, Indiana adopted NTE as the statewide teacher licensure exam in response to House Bill 1105, which required testing for proficiency in basic skills, general education, professional education, and license-specific subject area knowledge. Between 1985 and 1988 in Indiana, White candidates scored between 23 and 30 percentage points higher than their Black peers on the NTE (Kirby & Hudson, 1993).
ETS replaced the NTE in 1993 with the PRAXIS exams, which consisted of the PRAXIS I, a basic skills test in reading, writing, and mathematics, a Developmental Area or Pedagogy exam, and the PRAXIS II, which was a subject-area content knowledge assessment. Despite the name change, the exam remained the effectively the same, and the detrimental results for Black candidates also remained the same into the twenty-first century.
In 2011, ETS commissioned a national study (Nettles et al., 2011) to gauge the effect of PRAXIS on the national supply of Black teachers. The study arrived at the same conclusion that many other studies have expressed for decades. Black test takers experienced lower pass rates than White test takers. Based on a sample of 74,190 candidates that took the PRAXIS I exam between 2005 and 2009, Table B details the performance gaps between White and Black candidates on the PRAXIS I exams. Table C summarizes the performance gaps between White and Black candidates on select PRAXIS II exams.
| Reading | Writing | Mathematics | |
| Percentage of first-time Black test-takers who passed | 40.7 | 44.2 | 36.8 |
| Percentage of first-time White test-takers who passed | 81.5 | 79.5 | 78.2 |
| Source: Nettles, Steinberg, & Tyler (2011). Performance and passing rate differences of African American and White prospective teachers on Praxis Examinations: A joint project of the National Education Association and Educational Testing Service. | |||
| White | Black | ||||
| N | % pass | N | % pass | Pass rate gap | |
| MS Math overall | 28,059 | 80.0 | 2,850 | 48.2 | -31.8 |
| MS Math- math ed. majors | 715 | 90.9 | 93 | 59.1 | -31.8 |
| MS Math- math majors | 782 | 89.3 | 268 | 59.0 | -30.3 |
| Math CK overall | 21,440 | 72.6 | 2,347 | 25.3 | -47.3 |
| Math CK- math ed. majors | 5,393 | 83.1 | 286 | 34.6 | -48.5 |
| Math CK- math majors | 4,995 | 82.1 | 543 | 36.1 | -46.0 |
| Social Studies: CK overall | 29,853 | 83.9 | 2,153 | 47.6 | -36.3 |
| SS CK- social studies ed. majors | 6,701 | 86.3 | 292 | 54.5 | -31.8 |
| SS CK- social studies majors | 2,128 | 81.7 | 121 | 45.5 | -36.2 |
| SS CK- history majors | 8,963 | 85.3 | 540 | 52.8 | -32.5 |
| SS CK- political science majors | 1,579 | 90.7 | 219 | 56.6 | -34.1 |
| English- CK overall | 34,628 | 88.7 | 3,226 | 46.4 | -42.3 |
| English- English ed. majors | 6,748 | 91.4 | 459 | 51.6 | -39.8 |
| English- English majors | 12,718 | 90.7 | 1,195 | 51.0 | -39.7 |
| Note: CK = content knowledge, MS = middle school, SS = social studies, Pass rate gap = the gap in passing rates between Black and White candidates. Source: Nettles, Steinberg, & Tyler (2011). Performance and passing rate differences of African American and White prospective teachers on Praxis Examinations: A joint project of the National Education Association and Educational Testing Service. | |||||
Not surprisingly, the report’s conclusion acknowledged the “very large score gaps between African American and White teacher candidates on selected Praxis I and selected Praxis II tests” (p. 46).
The PRAXIS exam ended its run in Indiana in 2014 when Pearson was awarded the state’s teacher licensure exam contract. Pearson created CORE Assessments consisting of an identical suite of exams as the PRAXIS (basic skills, pedagogy, and subject-specific exams), however these assessments were customized to Indiana’s teaching and teacher standards. In 2019, worries about low pass rates for all candidates and a teacher shortage in Indiana led to the passing of two bills, House Bill 1002, which required the Indiana State Board of Education to adopt an examination program “that is already in existence and administered nationally to replace the current licensure test program” and Senate Enrolled Act 438 which eliminated the “basic skills assessment requirement for entry into an Indiana educator preparation program.” In 2021, ETS was once again awarded the state’s teacher licensure exam contract, and the PRAXIS II assessments (subject-specific exams) continue to serve as entry gate into the teaching profession.
Given the sordid history of teacher licensure exams in the United States and in Indiana as a tool to determine who will teach what to our students, each decade has repeatedly excluded Black professionals. The predecessor to the PRAXIS exams used in Indiana today have a direct lineage to the NTE, an exam used openly to justify and maintain racist dual salary systems and depress Black wages. Although many entities and individuals such as the National Education Association, the U.S. Department of Justice, the NAACP, and researchers, including ETS have acknowledged how exams systemically exclude Black educators from the workforce, each generation of policymakers has ignored the role of entrance exams in creating disparities between Black and White educators. Instead of acknowledging how this selection system has roots in institutional and ideological racism, policymakers have framed the problem as an issue of retention and recruitment. Scholarships, support services, and directives to hire more minority professional staff have certainly created opportunities, but the gate itself—teacher licensure exams—continues to replicate the “constructive solution” to keep Black professionals out of the classroom.
Teacher Licensure Exams in Indiana
Each time a generation of policymakers fails to recognize the broad demographic gaps in the composition of the teacher workforce, they squander added social, emotional, and academic value that research has made crystal clear exists when students of color are taught by teachers of color (e.g., Irvine, 1989; Milner, 2006; Naman, 2009; Bristol & Fernandez, 2019). According to the Indiana Department of Education, the teaching workforce in Indiana is comprised of 79,120 full-time educators. 92.1% of those educators identify as White, 4.6% identify as Black, and 1.8% identify as Hispanic. Contrastingly, Indiana educators serve a student population of over 1.2 million students. 66% identify as White, 12.5% identify as Black, and 13.2% identify as Hispanic. Based on the current composition of Indiana’s teacher workforce, recruitment of Black and Hispanic teachers is an insufficient policy response to the historical hurdles created by the licensing and credentialing process.
Because Indiana shifted its teacher licensure exams from the PRAXIS in 2019 to the CORE and then returned to PRAXIS in 2021, this report uses this opportunity to examine the effects of the CORE teacher licensure exam on the teacher workforce in Indiana and explores how the PRAXIS exam is constructed and how cut scores in Indiana are set. This change between exams provides both opportunities and limitations.
The shift from CORE to PRAXIS in 2021 means that it is possible to dismiss the effects reported below as a byproduct of a “new” or “more difficult” assessment. Indeed, the difficulty of the CORE assessments is what eventually led to the introduction of HB 1002 and the return to PRAXIS (Loughlin, 2015; Loughlin, 2019). Although the problem of low-test scores when new exams are introduced is understandable as universities and educator preparation programs work to realign their curriculum to new testing standards and expectations, “changing” the teacher licensure exam has always been a way to deflect its consistent disproportionate demographic impact. The NTE changed its format and structure repeatedly through its history (Wilson, 1986), including the change from NTE to PRAXIS. Regardless of the change, the exam, as the section above describes, resulted in the same demographic disparity. Considering this history, the results shared below of the impact of CORE Assessments on the prospective Indiana teacher workforce are not surprising, and cannot merely be attributed to a change in assessments because they continue to document a new chapter of the same story.
Conversely, the return to PRAXIS in 2021 provides an opportunity to examine another side of the teacher licensure examinations: how these exams are constructed and how cut scores are recommended and set. The ability of policymakers to effectively ignore the unequal effects of teacher licensure examinations is generally based on the belief that these examinations are a “valid” and, thus, an “objective” measure of teaching. However, the validity and objectivity of the NTE or any other teacher licensure exam has never truly been demonstrated as a function of job performance (e.g., Quirk et al., 1973; Goldhaber & Hansen, 2007; Goldhaber & Hansen, 2010) and instead utilized to maintain racial salary differentials, prevent the merging of White and Back school teachers, and keep the Black teacher workforce at a level well below the percentage of Black students that public schools serve.
The faith in the validity and objectivity of teacher licensure exams is the legacy of the 1978 U.S. Supreme Court rejection that relied on the assessment of 450 faculty members in South Carolina to determined that the NTE was a valid assessment. The rejection by the Supreme Court affirmed the use of NTE for certification and salary purposes, and subsequently led to its widespread adoption in the 1980s. However, the validation study that guided the Supreme Court decision is at best, questionable. According to McDaniel (1978):
“The validation study conducted in the fall of 1975 depended heavily upon the “professional judgement” or the subjective opinion of the panels of teacher educators. Content review panels were asked to make “judgement of whether or not the content of each question in the test is covered by the teacher education program” and also “judgements in relation between the description of the test content…and the curriculum in terms of omissions or overemphasis.” Knowledge estimation panels took on the even more subjective task of providing “estimates of the percentage of minimally knowledgeable candidates who would be expected to know the answers to individual test questions.” The concept of “minimally knowledgeable candidates” was to be determined by each member of the panel, and then an estimate of how many such individuals (in terms of percentage) would be able to answer the question. I myself participated in one of these panels and found the process to be highly subjective one, to say the least. Although the judgements were professional, the task of guessing how many “minimally qualified” individuals could answer a given question must raise some questions about the objectivity—and validity—of the study, even though the court was satisfied” (p. 188).
In the pages that follow, this report documents the first attempt passing rates of teacher candidates for the licensure tests required by Indiana between 2016 and 2021 by demographic category. Sadly, not much has changed since the first administration of statewide teacher licensure exam in 1985. White candidates continue to score significantly higher on these assessments than their non-White peers on virtually all teacher licensure exams. However, in addition to this analysis, this report will also explore the validation process for the PRAXIS exams that was made available to the Indiana State Board of Education during the 2021 re-adoption of the exam. The process used in 1975 is effectively the same process used today to establish the faith in the validity of the exam. As McDaniel noted above, the validation of teacher licensure exams is a highly subjective process littered with guesses. As this report suggests, a subjective process with a panel of experts that reflects the predominantly White teacher workforce in Indiana creates a self-reinforcing loop that continues to keep Black and Hispanic educators out of the classroom.
First Attempt Pass Rates, 2016-2021
To examine the effects of teacher licensure exams on Black and Hispanic candidates in Indiana, this section reports on the pass rates of candidates’ first attempts on the three types of exams required for teacher licensure between 2016 and 2021: (1) a basic skills assessment; (2) a pedagogy assessment; and (3)a subject area content knowledge assessment. Although the CORE Assessment program began in 2014, in order to explore the contemporary effects of this program on the demographic profile of Indiana’s teacher workforce, only the last five years of the program were analyzed.
Moreover, the first attempt pass rate is analyzed because of its documented importance in encouraging or discouraging the pursuit of a teaching license in Indiana (Bennett, et al., 2006). Depending on the certification area, candidates have to sit for up to seven different tests. For example, when a basic skills test was required in Indiana, a candidate pursuing certification as an elementary educator had to pass the following suite of assessments:
- Basic Skills: Mathematics
- Basic Skills: Reading
- Basic Skills: Writing
- Elementary Education Generalist: Reading/English Language Arts
- Elementary Education Generalist: Mathematics
- Elementary Education Generalist: Science/Health/Physical Education
- Elementary Education Generalist: Social Studies/Fine Arts
- Elementary Education Pedagogy
Each test requires a substantial time commitment and comes with significant financial and emotional costs, in particular, when the test is not passed on the first attempt. Subsequent attempts often financially prohibit and/or emotionally discourage candidates to continue to pursue certification (Albers, 2002; Petchauer, et al., 2015). Even when candidates persist beyond the first attempt, research has also indicated that the pass rate drastically declines with subsequent attempts (Gitomer, 2011). As such, using the first attempt to analyze the CORE Assessments (basic skills and subject areas exams) used in Indiana between 2016 and 2021 provides a reliable snapshot of the screening effects of teacher licensure exams on Black and Hispanic candidates.
The Core Academic Skills Assessment (CASA), 2014-2019
Between 2014 and 2019, the required basic skills assessment was the Core Academic Skills Assessment (CASA), which replaced PRAXIS I. CASA consisted of three subtests: reading, mathematics, and writing. The reading and mathematics tests were 40 multiple choice questions; and the writing test consisted of 42 multiple choice questions, and one constructed response assignment. In total, candidates had four and a half hours to complete all three subtests. Each subtest cost candidates $38.
Approximately 7,000 candidates attempted the CASA subtests between 2016 and 2019. As Table D indicates, White candidates passed the mathematics, reading, and writing subtests at a significantly higher rate than their Black and Hispanic counterparts. The mathematics subtest had the largest pass rate gap with 29 percentage points between Black and White candidates, and the reading subtest had the smallest difference among Black, Hispanic, and White candidates. For candidates of color, the adverse effects of the pass rate gap were twofold. First, there was financial and emotional discouragement of failing the CASA subtest. Second, research suggests that there is a significant relationship that exists between passing the basic skills exams such as CASA on the first try and success on future subject area exams (Gitomer, 2011).
In other words, even if the candidate persists, the relatively low first-time pass rate on CASA predicts future challenges with other licensure assessments at approximately the same differences among demographic groups, disproportionately filtering out more and more candidates of color.
Because all three CASA subtests were required to pass the “basic skills” requirement, the pass rate gaps winnowed the future pool of teachers of color for Indiana. For example, on the mathematics subtest, 7,177 candidates attempted the test and 5,142 passed the test on the first attempt. Black candidates were approximately 7% (n=443) of the possible future pool of teachers. However, after failing the first attempt, the prospective number of Black candidates in the total pool of future certified teachers in Indiana dwindles to 3% (n=199).
| Black | Hispanic | White | |||||
| N | Pass Rate | N | Pass Rate | N | Pass Rate | Max Gap | |
| Mathematics | 443 | 45% | 389 | 64% | 6345 | 74% | -29 |
| Reading | 449 | 78% | 405 | 82% | 6494 | 88% | -10 |
| Writing | 432 | 56% | 387 | 66% | 6429 | 74% | -18 |
Developmental Area (Pedagogy) Exams, 2016-2021
In addition to the basic skills exam, between 2016 and 2021 candidates also had to pass developmental area—or pedagogy—exams. Depending on the area of certification, candidates were required to take one of four exams: Early Childhood Education (P-3); Elementary Education (K-6); Secondary Education (5-12); or Preschool through Grade 12 Education (P-12). The pedagogy exams covered strategies of teaching such as methodology, classroom management, student development and diversity, learning processes, learning environment, instructional planning, assessments and the professional teaching environment. The exam was 100 multiple-choice questions that candidates had 1.5 hours to complete, and cost $114.
Table E indicates the same pattern found in the CASA basic skills assessments, White candidates passed the Developmental Area (Pedagogy) exams at a higher rate than their Black and Hispanic counterparts. Although the maximum pass rate gaps are similar to those found in the CASA analysis, the pedagogy exams are perhaps more promising because the overall pass rates for Black and Hispanic candidates are relatively higher than CASA. As such, the factors that hamper progress toward certification, such as financial or emotional costs of failing the first attempt of a licensure exam, are mitigated by the relatively higher overall first attempt pass rates across all demographics.
| Black | Hispanic | White | |||||
| N | Pass Rate | N | Pass Rate | N | Pass Rate | Max Gap | |
| Elementary | 245 | 69% | 306 | 79% | 7,545 | 87% | -18 |
| Secondary | 228 | 76% | 233 | 80% | 4,826 | 93% | -17 |
Subject Area Exams, 2016-2021
The third exam candidates were required to take for certification between 2016 and 2021 was a subject area exam. These exams varied in length and scope, depending on the licensure area. Similarly, the time allotted and cost of subject area exams depended on the certification area candidates pursued. Elementary and early childhood teacher candidates needed to pass all four sections of a generalist exam that consisted of the following subtests:
- Reading & Language Arts
- Mathematics
- Science, Health, and Physical Education
- Social Studies and Fine Arts
Across the four subtests, the generalist exams for elementary and early childhood candidates were 180 multiple choice questions, and candidates had 3.5 hours to complete the entire exam. Each generalist subtest cost $45 individually or $145 if all four subtests were taken at once.
Candidates seeking middle school certification in one of the four core disciplines had to pass one test: Middle School Language Arts; Mathematics; Science; or Social Studies. Middle school content area exams were 100 multiple-choice questions; candidates had 1.5 hours to complete the exam which cost $80.
Candidates seeking to teach in grades 9-12 had to pass one exam in a specific area of concentration. For example, prospective high school social studies teachers had the choice of passing an exam in content areas such as: Historical Perspectives; Economics; Government and Citizenship; or Psychology. Secondary content area exams were between 70 and 100 multiple-choice questions; candidates had between 1.5 and 2 hours to complete the exam which cost $80.
Because Black and Hispanic candidates are only 7% of the total test taking population in Indiana, to properly examine the effects of these subject area exams between 2016 and 2021, only nine subject area exams provided an opportunity to examine the first attempt pass rate differentials between White and Black and/or Hispanic candidates.
As Table F illustrates, White candidates surpassed the first-time pass rate of Black and/or Hispanic peers every year in each of the nine subject area exams, with the exception of the English Language Arts content area exam in 2016-2017 and the Elementary generalist mathematics subtest in 2018-2019. In many instances, the pass rate gaps double digits, with a maximum gap of 52 percentage points between White and Black candidates that attempted the secondary Mathematics subject area exam in 2016-2017.
| 2016-2017 | Black | Hispanic | White |
| Elementary: Reading | 48% | 53% | 70% |
| Elementary: Math | 29% | 51% | 69% |
| Elementary: Science | 58% | 66% | 80% |
| Elementary: Social Studies | 38% | 48% | 61% |
| English Language Arts | 67% | 62% | 65% |
| Mathematics | 0% | <10 | 52% |
| Middle School Mathematics | 17% | <10 | 44% |
| Life Sciences | <10 | <10 | 58% |
| Historical Perspectives | 20% | <10 | 46% |
| 2017-2018 | Black | Hispanic | White |
| Elementary: Reading | 59% | 44% | 63% |
| Elementary: Math | 36% | 44% | 67% |
| Elementary: Science | 58% | 59% | 80% |
| Elementary: Social Studies | 51% | 50% | 61% |
| English Language Arts | <10 | <10 | 75% |
| Mathematics | <10 | <10 | 47% |
| Middle School Mathematics | 31% | <10 | 39% |
| Life Sciences | <10 | <10 | 32% |
| Historical Perspectives | 27% | <10 | 51% |
| 2018-2019 | Black | Hispanic | White |
| Elementary: Reading | 42% | 57% | 60% |
| Elementary: Math | 47% | 75% | 75% |
| Elementary: Science | 49% | 72% | 79% |
| Elementary: Social Studies | 29% | 53% | 59% |
| English Language Arts | 5% | 36% | 68% |
| Mathematics | 18% | <10 | 48% |
| Middle School Mathematics | 25% | 33% | 45% |
| Life Sciences | <10 | <10 | 61% |
| Historical Perspectives | <10 | <10 | 49% |
| 2019-2020 | Black | Hispanic | White |
| Elementary: Reading | 48% | 46% | 63% |
| Elementary: Math | 57% | 70% | 77% |
| Elementary: Science | 68% | 65% | 81% |
| Elementary: Social Studies | 55% | 51% | 67% |
| English Language Arts | 6% | 38% | 67% |
| Mathematics | <10 | <10 | 43% |
| Middle School Mathematics | <10 | <10 | 48% |
| Life Sciences | <10 | <10 | 56% |
| Historical Perspectives | <10 | <10 | 47% |
| 2020-2021 | Black | Hispanic | White |
| Elementary: Reading | 36% | 48% | 60% |
| Elementary: Math | 38% | 65% | 70% |
| Elementary: Science | 46% | 62% | 79% |
| Elementary: Social Studies | 39% | 45% | 58% |
| English Language Arts | 22% | 21% | 65% |
| Mathematics | 17% | <10 | 48% |
| Middle School Mathematics | 26% | <10 | 75% |
| Life Sciences | 10% | <10 | 51% |
| Historical Perspectives | <10 | 17% | 42% |
| BOLD numbers indicate the demographic group with the higher pass rate (when a comparison is possible). | |||
Tables G and H take a closer look at the pass rate differential in terms of the actual number of candidates that are potentially screened out or discouraged by a failed first attempt. Table G compares the number of Black and White candidates for six select examsb and Table H compares the number of Hispanic and White candidates on six different exams. Like CASA, a low first attempt pass rate for Black or Hispanic candidates winnows the future teacher candidate pool in Indiana. For example, on the 2016- 2017 Mathematics subject area exam, a 17% first time pass rate means that of the 12 Black mathematics educators that could have entered the workforce that year, only 2 made it into the candidate pool without a discouraging experience. Comparatively, the 52% first time pass rate meant that, of the 190 possible White candidates, 99 entered the candidate pool without a discouraging experience.
Similarly, of the 12 Hispanic social studies educators that could have entered the workforce in 2020- 2021, the 17% first attempt pass rate meant that only 2 entered the candidate pool without a discouraging experience, while 185 White candidates made progress toward possible employment. Although time, financial cost, and the emotional burden of failing an high-stakes exam are prohibitive factors across all demographics, initial failure disproportionately winnowed the handful of Black and Hispanic candidates that sought certification in Indiana between 2016 and 2021.
| Black | White | |||||
| N | Pass Rate | Screened/ Discouraged | N | Pass Rate | Screened/ Discouraged | |
| 2016-2017: Mathematics | 12 | 17% | 10 | 190 | 52% | 99 |
| 2017-2018: Historical Perspectives | 15 | 27% | 11 | 300 | 51% | 148 |
| 2018-2019: English Language Arts | 22 | 5% | 21 | 330 | 68% | 104 |
| 2019-2020: English Language Arts | 17 | 6% | 16 | 273 | 67% | 182 |
| 2020-2021: Elementary Mathematics | 71 | 38% | 57 | 1,805 | 70% | 503 |
| 2020-2021: Life Sciences | 10 | 10% | 9 | 21 | 51% | 6 |
| Hispanic | White | |||||
| N | Pass Rate | Screened/ Discouraged | N | Pass Rate | Screened/ Discouraged | |
| 2016-2017: Elementary Mathematics | 53 | 51% | 26 | 1,700 | 69% | 534 |
| 2017-2018: Elementary Science | 70 | 59% | 29 | 1,577 | 80% | 322 |
| 2018-2019: English Language Arts | 11 | 36% | 7 | 330 | 68% | 104 |
| 2019-2020: English Language Arts | 13 | 38% | 8 | 273 | 67% | 182 |
| 2020-2021: English Language Arts | 19 | 21% | 15 | 392 | 65% | 138 |
| 2020-2021: Historical Perspectives | 12 | 17% | 10 | 317 | 42% | 185 |
To further illustrate the winnowing effects of the subject area exam on the prospective pool of teachers of color, Table I features data for the English Language Arts subject area exams between 2018 and 2021, one of the few exams where first attempt pass rate data was available for consecutive years across all three demographic categories. Black and Hispanic candidates were approximately 9% (n=105) of the total first time test taking population. However, after taking the English Language Arts subject area exam, the percentage of Black and Hispanic candidates that made progress toward entering the pool of available secondary English Language Arts teachers for school districts dwindled to .03% (n=20). Likely, some of the 85 candidates of color and 333 white candidates attempted the exam again. However, because candidates will be affectively discouraged, financially unable to afford a second or third attempt, or simply continue to not pass in subsequent tries, the eventual demographics of the pool of teachers available for districts to hire may be similar to the available pool after the first attempt.
| Black and Hispanic Combined | White | |||||
| N | Screened/ Discouraged | Entering Pool of Available Teachers | N | Screened/ Discouraged | Entering Pool of Available Teachers | |
| 2018-2019 | 33 | 28 | 5 | 330 | 104 | 226 |
| 2019-2020 | 30 | 24 | 6 | 273 | 91 | 182 |
| 2020-2021 | 42 | 33 | 9 | 392 | 138 | 254 |
| Three Year Totals | 105 | 85 | 20 | 995 | 333 | 662 |
Across the nine subject area exams analyzed, this winnowing pattern exists over and over for candidates of color, in particular for Hispanic candidates, where on many occasions, there were not enough candidates for data to be released by the Indiana Department of Education.
Validating Licensure Exams, 2020-2021
The data in the preceding section demonstrates the adverse effects of basic skills and subject area licensure exams on the potential pool of candidates of color in Indiana between 2016 and 2021. However, since the emergence of teacher licensure exams in 1940, these adverse effects on the Black and Hispanic teacher workforce have been constant yet have failed to prompt substantive policy changes. Despite the racist legacy and continued deleterious demographic effects, what has sustained the use of teacher licensure exams has been the belief, substantiated by the Supreme Court in 1978, in the objectivity of these examinations, which are derived in part by how the licensure exams are validated.
This section of the report explores how the PRAXIS exams, which succeeded the CORE Assessments, are constructed and validated. More specifically, this report raises questions about the demographic composition of the panels of subject matter experts that determine test items and cut scores for teacher licensure exams. Although the process of validating and constructing licensure exams is not capricious, research has revealed how this process is highly subjective. Given the adverse effects of licensure exams on the prospective pool of future teachers of color, this section of the report explores how the demographic composition of panels engaging in a highly subjective construction and validation process contributes to pass rate gaps between that have remained the same for decades.
How Are Exams Constructed and Validated?
In order for high stakes assessments, such as teacher licensure exams, to be legally defensible, they must undergo a standard-setting study. A standard-setting study typically involves focus groups of subject matter experts that determine and differentiate different classifications, such as competent or incompetent. In the case of teacher licensure exams, testing companies such as Pearson, which developed the CORE Assessments for Indiana, or ETS, which developed the PRAXIS exams, generally use the modified Angoff method (Brandon, 2004; Hambleton & Pitoniak, 2006) to help determine the items that belong in an assessment and the cut scores that distinguish qualified from unqualified candidates.
The Angoff standard-setting process follows five steps with subject matter experts (SME’s), which in the case of teacher licensure exams, are teachers and teacher educators. First, the SME’s are asked to take the test and discuss it. According to ETS (2021), this discussion helps “bring the panelists to a shared understanding of what the test does and does not cover, which serves to reduce potential judgement errors later in the standard setting process.” (p. 3). After the review of the test, the panelists determine the “just qualified” candidate. To create this description, “the panel first split into smaller groups to consider the just qualified candidate” then, the full panel reconvenes, and through whole group discussion “determines the description of the just qualified candidate to use for the remainder of the study.” The determination of the just qualified candidate is not intended to “describe all the knowledge of the just qualified candidate, but only highlight those that differentiate a just qualified candidate from a not quite qualified candidate” (p. 4). After the discussion of the “just qualified” concludes, each panelist judges each item on the “likelihood (probability or chance) that the just qualified candidate would answer the item correctly” (p. 4). Panelists make their judgement using the following rating scale:
0, .05, .10, .20, .30, .40, .50., .60, .70, .80, .90, .95., 1.
For ETS, the “lower the value, the less likely it is that a just qualified candidate would answer the item correctly because the item is difficult for the just qualified candidate” (p. 4). Next, the SME panel is asked to review the description of the just qualified candidate, and the item, and then, panelists decide how to refine their judgments. In other words, “if a panelist thought there was a high chance that the just qualified candidate would answer the question correctly, the initial decision would be in the .70 to 1 range…the second decision for the panelist was to judge if the likelihood of answering it correctly is .70, .80, .90, .95, or 1” (p. 5). According to ETS, the purpose of this discussion is not to “encourage panelists to conform to another’s judgement, but to understand the different relevant perspectives among the panelists” (p. 5).
The final stage of the Angoff method requires panelists to share their rationale for the judgements and consider their judgements in light of the rationales provided by other panelists. If panelists wish to change their initial judgement, they record this judgement. Final judgements made by the panel are recorded—including any changes from the initial perception of an item by the panelists—for the study. Panelists’ scores are tabulated and the median estimates for each item are used to calculate the performance level of each item. These scores are then summed, and a “panel recommended score” is determined. Table J is a sample of the Journalism passing score summary by round of judgements provided by ETS for this exam. The panel recommended score of 61.68 is then scaled to allow direct comparison between candidates from different test administrations. In the case of the Journalism exam, the scaled score associated with 61.68 is 153 on a 100-200 scale.
| Panelist | Round 1 | Round 2 |
| 1 | 56.90 | 59.20 |
| 2 | 57.55 | 60.05 |
| 3 | 66.40 | 64.60 |
| 4 | 61.70 | 61.70 |
| 5 | 60.90 | 60.70 |
| 6 | 53.80 | 52.70 |
| 7 | 61.35 | 62.75 |
| 8 | 55.00 | 54.40 |
| 9 | 66.40 | 65.50 |
| 10 | 68.60 | 68.70 |
| 11 | 60.70 | 60.90 |
| 12 | 67.35 | 66.75 |
| 13 | 64.85 | 63.85 |
| Average | 61.65 | 61.68 |
| Lowest | 53.80 | 52.70 |
| Highest | 68.60 | 68.70 |
| Standard Deviation | 4.86 | 4.55 |
| Standard Error of Judgement | 1.35 | 1.26 |
| Standard Deviation = the reliability of the recommendation, Standard Error of Judgement = the reliability of the panelists’ passing-score recommendation. Source: PRAXIS Journalism (5224) Multistate Standard-Setting Technical Report, Educational Testing Service, March 2021 | ||
After a passing score is determined, ETS provides this data along with a standard measurement of error (SEM) assessment, which represents the “uncertainty associated with a test score” (p. 8). The scale scores associated with one and two SEM above and below the recommended passing scores are then provided to the proper state agencies for decision-making. In the case of Indiana, test vendors such as ETS provide this information to the Indiana Department of Education (IDOE), which then makes a recommendation to the Indiana State Board of Education (ISBE) for final adoption of a cut score.
Generally, IDOE and ISBE follow the recommended cut scores provided by test vendors. However, in some cases the IDOE makes adjustments in their recommendation based along the standard error of measurement (SEM) For example, when recommending cut scores for a suite of ETS exams in December 2020, IDOE recommended one SEM below the recommended panel score on exams where panels consisted of less than six educators. According to the IDOE (2020), for some panels, “this was anticipated because the content areas had a small pool of educators from which to recruit. For others, there were 6-12 educators registered for the study, but some did not participate for various reasons” (pp. 4-5).
Who Is In the Room Where it Happens?
The Angoff method is a testing industry standard that has been used to validate and set cut scores for teacher licensure exams for decades. Indeed, the Angoff method was used in the validation study that helped the Supreme Court in its ruling that NTE scores in South Carolina were not being used to discriminate against Black teachers and teacher candidates in the 1970s. However, as McDaniel (1978) recounted from his participation in that validation study, the process was, to say the least, a “highly subjective one…the task of guessing how many ‘minimally qualified’ individuals could answer a given question must raise some question about the objectivity—and validity—of the study, even though the court was satisfied” (p. 188).
Given the importance of the subject matter experts in determining critical question such as the traits of a “just qualified candidates”; the likelihood that a “just qualified candidate” would answer a particular question on a given scale; and whether or not to adjust those scores based on a discussion with other panelists, it is worth examining more closely who exactly are the individuals making those decisions. Ultimately, decisions about “just qualified candidates” and “likelihood to answer” among panelists lead to the cut scores that candidates have to meet across the state. Because these panel-based cut scores have historically and presently created disproportionate score gaps for Black and Hispanic teacher candidates, this report analyzes the demographic composition of the panels used to validate the cut scores for the PRAXIS II exams currently used in Indiana.
Considering the demographic composition of the “subject matter expert” panels is important because judges’ cognitive processes are rarely considered as a variable in outcomes of high-stakes assessments (Katz, 2019). Research into the Angoff method has raised a number of issues that empirically substantiate McDaniel’s (1978) assertion that validation studies are littered with “guesses.” One such issue is the should/would problem detailed by McGinty (2005). In her study of two subject matter expert panels consisting of teachers, she detailed how panelists often have difficulty with the relationship between prediction and probability. In reality, the task of determining how a “just qualified” candidate would perform is both a value judgement and prediction. According to McGinty (2005), the “value judgement lies in envisioning a minimally competent examinee; each judge will have his or her own conception of what constitutes minimal competence. The prediction involves estimating how difficult the item would be for this examinee” (p. 279). In her study:
"The panelists…often seemed to have lost the sense in which the value judgement is inherent in this task. Frequent questions at both meetings focused on the distinction between what a borderline student “would” do and what a borderline student “should” do. As one participant said during the second round of standard setting, “I’m still struggling with the word ‘probability’ Are we supposed to estimate what they will do or what they should do?”" (p. 279)
This should/would problem has also been validated by other research (e.g., Beck, 2003; Plake et al., 2000), leading McGinty to conclude that the “validity of the results from the Angoff method is seriously threatened if we fail to understand the cognitive task involved” (p. 280).
Another documented problem with the Angoff method is that judges asked to evaluate broad content domains (e.g., mathematics, U.S. history, social studies, science, life sciences) understandably have knowledge gaps. When rating unfamiliar items, judges tend to rate unfamiliar items more difficult than familiar items. According to Clauser et al. (2016), judges’ opinions “may be contaminated by systematic error when judges are presented with unfamiliar test content” and tend to yield artificial ratings that position unfamiliar knowledge as more difficult for a “just qualified” candidate.
In light of the should/would and unfamiliar knowledge problems with the Angoff method, the demographics of the subject matter expert panels matter because decades of research in a variety of fields such as social psychology, neuroscience, and sociology have confirmed the existence of unconscious bias—the ways implicit beliefs, in particular about race influence individuals’ judgements and actions. Because of their hierarchical nature, schools—where the majority of panelists that make decisions about teacher licensure exams work—are particularly susceptible to elements that lead to unconscious bias about students of color. The existence of teachers’ negative stereotypes about Black and Hispanic populations are well documented in the education research literature (Mello et al., 2012; Osborne, 2006; Wasserberg, 2014). Additionally, organizational factors in schools (such as all White social networks), reinforce stereotypes and influence how teachers sustain unconscious biases. Furthermore, within a school, transitory exposure to unconscious bias exposes minority students to low expectations, which become reinforced by low performance and confirms for teachers, unconscious stereotypes (Loury, 2003; Spencer at al., 2016).
The implicit ways that unconscious bias operates in schools leads to real consequences for students of color (Blanton & Jaccard, 2008). Arguably then, this same unconscious bias that commonly exists in schools is bound to influence teachers’ subjective judgements as subject matter experts on a panel that determines the characteristics of a just qualified teacher and how that just qualified teacher may or may not answer a particular test item. Research on the cognitive processes of teachers during standard-setting studies suggest prior perceptions of the performance of different subgroups substantially influence how teachers develop operational notions of target competencies (Giraud, et al., 2005). As such, the implicit cognitive imaginations of teachers (and teacher educators) as subject matter experts are primed to reinforce themselves as the in-group and others as an out-group.
The decision-making process during the Angoff method is fraught with cognitive tensions for panelists, and the realities of unconscious bias for the school teachers that make up the majority of teacher licensure exam standard setting studies create an imperative to consider the relationship between the demographics of the decision-makers and the disparate impact of those decisions on the demographic population of test-takers.
PRAXIS Validation in Indiana
In July, 2019 in accordance with the action taken by the 2019 Indiana legislature, the PRAXIS exams administered by ETS were adopted by the Indiana State Board of Education to provide educator licensure exams starting September 1, 2021. After adoption, ETS and the Indiana Department of Education (IDOE) began working on establishing cut scores for the PRAXIS exams that aligned with Indiana teacher licenses. Because PRAXIS, the predecessor of the National Teacher Examination, is used by other states to determine licensure, ETS convened panels of Indiana educators to validate their assessments and recommend cut scores. These score-setting studies were conducted throughout 2020, using the Angoff method to determine test construction and validation. The first set of studies were held for 24 PRAXIS exams between February 27 and July 1, 2020. These studies were distance-based score setting workshops because of the COVID-19 pandemic. The second set of distance-based score setting studies for an additional 18 PRAXIS exams were held between July 20 and September 30, 2020.
The subject matter expert panels for these 42 exams consisted of Indiana teachers, teacher educators, and other stakeholders such as IDOE officials. Memos, describing the Angoff method, recommended cut scores, and the names and institutions of panelists were shared with the Indiana State Board when IDOE was seeking final approval of the cut scores. Because these memos did not include the demographic composition of the subject matter experts, the names and institutions of the educators that served as judges were compared to the certified educator data base in an analysis conducted by IDOE. Table K lists the licensure exam, total number of panel members that determined cut scores, and the demographic breakdown of the certified educators that served on these panels between February 27 and July 1, 2020. Because faculty from Indiana’s higher education institutions are not part of the certified educator database, their information was not included. However, because certified educators constituted the majority of the panels, the demographic breakdown provides a representation of the demographic composition of the subject matter expert panels. Table L lists the licensure exam, total number of panel members that determined cut scores, and the demographic breakdown of the certified educators that served on these panels between July 20 and September 30, 2020.
| Test | Position | |||
| Panel | Faculty | Educators | Others | |
| Principles of Teaching and Learning: 7-12 | 4 | 3 | 1 | 0 |
| Principles of Teaching and Learning: ECE | 6* | 4 | 1 | 0 |
| Principles of Teaching and Learning: K-6 | 6* | 4 | 1 | 0 |
| Computer Science | 5* | 0 | 4 | 0 |
| Business Education | 9 | 1 | 8 | 0 |
| English Language Arts | 6* | 3 | 2 | 0 |
| Middle School ELA | 6* | 3 | 2 | 0 |
| Family and Consumer Sciences | 8 | 0 | 7 | 1 |
| Agriculture | 6 | 1 | 5 | 0 |
| Marketing Education | 9* | 0 | 8 | 0 |
| Special Education: Mild/ Moderate | 7 | 3 | 4 | 0 |
| Special Education: Severe | 7 | 2 | 5 | 0 |
| Special Education: Deaf & Hard of Hearing | 3 | 1 | 2 | 0 |
| Special Education: Visual Impairments | 3 | 2 | 1 | 0 |
| Health Education | 7 | 3 | 4 | 0 |
| Physical Education Gifted | 5 | 4 | 1 | 0 |
| Education | 8 | 1 | 6 | 0 |
| ESOL | 8 | 3 | 5 | 0 |
| Technology Education | 6 | 1 | 5 | 0 |
| World Languages: Spanish | 5 | 1 | 4 | 0 |
| World Languages: French | 7 | 0 | 7 | 0 |
| World Languages: German | 9 | 0 | 8 | 0 |
| World Languages: Latin | 4 | 1 | 3 | 0 |
| World Languages: Chinese | 2 | 0 | 2 | 0 |
| TOTALS | 146 | 41 | 96 | 1 |
| Test | Demographics | ||||
| White | Black | Hispanic | Asian | Not Identified | |
| Principles of Teaching and Learning: 7-12 | - | - | - | - | 4 |
| Principles of Teaching and Learning: ECE | - | - | - | - | 6 |
| Principles of Teaching and Learning: K-6 | - | - | - | - | 6 |
| Computer Science | 2 | 1 | 0 | 0 | 2 |
| Business Education | 6 | 0 | 0 | 0 | 3 |
| English Language Arts | 1 | 0 | 0 | 0 | 5 |
| Middle School ELA | 1 | 0 | 0 | 0 | 5 |
| Family and Consumer Sciences | 6 | 0 | 0 | 0 | 2 |
| Agriculture | 5 | 0 | 0 | 0 | 1 |
| Marketing Education | 5 | 1 | 0 | 0 | 3 |
| Special Education: Mild/ Moderate | 4 | 0 | 0 | 0 | 3 |
| Special Education: Severe | 5 | 0 | 0 | 0 | 2 |
| Special Education: Deaf & Hard of Hearing | 2 | 0 | 0 | 0 | 1 |
| Special Education: Visual Impairments | 1 | 0 | 0 | 0 | 2 |
| Health Education | 3 | 0 | 0 | 0 | 4 |
| Physical Education Gifted | 1 | 0 | 0 | 0 | 4 |
| Education | 5 | 0 | 1 | 0 | 1 |
| ESOL | 3 | 0 | 1 | 0 | 4 |
| Technology Education | 3 | 1 | 0 | 0 | 2 |
| World Languages: Spanish | 1 | 0 | 1 | 0 | 3 |
| World Languages: French | 6 | 0 | 0 | 0 | 1 |
| World Languages: German | 7 | 0 | 0 | 0 | 1 |
| World Languages: Latin | 3 | 0 | 0 | 0 | 1 |
| World Languages: Chinese | 0 | 0 | 0 | 2 | 0 |
| TOTALS | 70 | 3 | 3 | 2 | 66 |
| * indicates a standard setting study where participant position was not disclosed | |||||
| Test | Position | |||
| Panel | Faculty | Educators | Others | |
| U.S. and World History | 1 | 1 | 0 | 0 |
| Geography | 2 | 1 | 1 | 0 |
| Economics | 2 | 1 | 1 | 0 |
| Government | 3 | 3 | 0 | 0 |
| Psychology | 2 | 0 | 2 | 0 |
| Middle School Social Studies | 1 | 1 | 0 | 0 |
| Teaching Reading | 6 | 1 | 5 | 0 |
| Art | 6 | 0 | 6 | 0 |
| Theater | 6 | 0 | 6 | 0 |
| Biology | 3 | 0 | 3 | 0 |
| Physics | 8 | 1 | 7 | 0 |
| Earth & Space Sciences | 7* | 0 | 6 | 0 |
| Chemistry | 7 | 1 | 6 | 0 |
| TOTALS | 54 | 10 | 43 | 0 |
| Test | Demographics | |||||
| White | Black | Hispanic | Asian | Native American | Not Identified | |
| U.S. and World History | 0 | 0 | 0 | 0 | 0 | 1 |
| Geography | 1 | 0 | 0 | 0 | 0 | 1 |
| Economics | 1 | 0 | 0 | 0 | 0 | 1 |
| Government | 0 | 0 | 0 | 0 | 0 | 3 |
| Psychology | 2 | 0 | 0 | 0 | 0 | 0 |
| Middle School Social Studies | 0 | 0 | 0 | 0 | 0 | 1 |
| Teaching Reading | 5 | 0 | 0 | 0 | 0 | 1 |
| Art | 4 | 0 | 0 | 0 | 1 | 1 |
| Theater | 6 | 0 | 0 | 0 | 0 | 0 |
| Biology | 2 | 0 | 0 | 0 | 0 | 1 |
| Physics | 7 | 0 | 0 | 0 | 0 | 1 |
| Earth & Space Sciences | 6 | 0 | 0 | 0 | 0 | 1 |
| Chemistry | 3 | 0 | 0 | 0 | 0 | 4 |
| TOTALS | 37 | 0 | 0 | 1 | 0 | 16 |
| * indicates a standard setting study where participant position was not disclosed | ||||||
Across the 37 licensure exams that were approved by the Indiana State Board of Education, the subject matter expert panels consisted of 200 Indiana education stakeholders. 51 were faculty, 139 were certified educators, and 1 was from the Indiana Department of Education. The demographic information for 23 certified educators was not available because some educators chose to not to identify themselves during the standard-setting process or the certified educator database did not otherwise have the demographic information for some educators.
In total, of the 116 certified educators that participated in the standard-setting studies where demographic information was available: 92% identified as White (107); 2% identified as Black (3); 2% identified as Hispanic (3); and less than 1% identified as either Asian (2) or Native American (1). Perhaps not surprisingly, the demographic breakdown of the teachers used as subject matter experts is similar to the overall demographic population of the Indiana teacher workforce.
Although limited, the data reveal some important insights. Black certified educators appeared as experts in only three subject matter expert panels: Computer Science, Technology Education and Marketing.
Likewise, Hispanic educators appeared as experts in three panels: ESOL, Gifted, and World Languages: Spanish. Asian expert educators only appeared in the World Languages: Chinese panels, and Art was the only panel featuring a Native American expert educator.
Beyond the demographic composition of the panels, the memos by IDOE also revealed insights into the number of panelists per examination. Because the Angoff method relies on discussions among panelists to determine the characteristics of a “just qualified” candidate and how that “just qualified” candidate might perform on certain test items, the minimum number of panelists needed to ensure the reliability of those decisions is six (Fowell, 2008). Only 21 of the 37 panels met that minimum threshold. In some cases, assessments in the four core disciplines only had one or two panelists. Most notably, several of the social studies exams had two or three panelists, and in the case of the U.S. History and World History and Middle School Studies panels, only one judge, a faculty member, made decisions about “just qualified” candidates and the appropriate cut score. Economics, Psychology, and Geography were the only social studies panels that featured participation from secondary social studies teachers.
Several of the social studies standard setting studies did not meet the minimum threshold of six panelists. U.S. History and World History had one panelist making cut score decisions for the state of Indiana.
To its credit, IDOE acknowledged this problem and the recommended cut scores lowered by 1 standard error of measurement in order to account for the failure to meet the minimum number of panelists. However, given all of the issues associated with the Angoff method and the high-stakes and consequential nature of examinations for teacher candidates and the broader composition of the teacher workforce in Indiana, one panelist prospectively determining what a “just qualified” Middle School Social Studies or U.S. and World History teacher looks like for the state of Indiana is concerning and raises questions about the reliability of the process.
For several other exams, IDOE recommended the adoption of cut scores determined by standard setting studies conducted by ETS with educators from states—including Indiana—where the PRAXIS is used for licensure and certification. Cut scores for the following 10 exams were adopted between March, 2021 and June 2021:
- Elementary generalist exams
- Early Childhood generalist exams
- Middle School Math
- Middle School Science
- Mathematics
- Journalism
- Physical Science
- Japanese
- Instrumental Music
- Vocal Music
Unlike the Indiana specific panels, the multistate standard setting technical reports by ETS included the demographic and position breakdown and of all participants that participated in the panels. Table M provides a summary of the demographic and positions of panelists for each of the 10 exams.
| Position | Demographics | ||||||
| Teacher | Faculty | Other | Black | Hispanic | White | Varied | |
| Principles of Learning and Teaching K-12 | 1 | 1 | 0 | 0 | 0 | 0 | 1 |
| Elementary Generalist | 2 | 16 | 0 | 0 | 0 | 17 | 1 |
| Early Childhood Generalist | 7 | 14 | 4 | 2 | 1 | 20 | 2 |
| Middle School Math | 14 | 10 | 4 | 3 | 0 | 24 | 1 |
| Middle School Science | 18 | 8 | 5 | 4 | 3 | 22 | 2 |
| Mathematics | 12 | 8 | 5 | 2 | 0 | 23 | 0 |
| Journalism | 12 | 0 | 1 | 0 | 0 | 13 | 0 |
| Japanese | 6 | 2 | 2 | 0 | 0 | 4 | 6 |
| Instrumental Music | 9 | 2 | 1 | 2 | 0 | 10 | 0 |
| Vocal Music | 10 | 2 | 0 | 1 | 1 | 10 | 0 |
| TOTAL | 96 | 68 | 23 | 14 | 8 | 152 | 13 |
Across the 10 exams, 187 education stakeholders from various states participated as panelists. The majority of participants on these panels were either educators or higher education faculty members. Some exams (indicated in the “Other” category) included K-12 administrators, department heads, and instructional coaches, as well as state education agency officials. 81% of the total panelists identified as White; 7% identified as Black; 4% identified as Hispanic; and 6% of the panelists identified from a variety of backgrounds such as Asian or Asian American, Native American, or Caucasian/African American. Table N provides the demographic representation of each panel by percentages.
| N | Black | Hispanic | White | Varied | |
| Principles of Learning and Teaching K-12 | 13 | 0% | 23% | 69% | 7% |
| Elementary Generalist | 18 | 0% | 0% | 94% | 5% |
| Early Childhood Generalist | 23 | 8% | 4% | 73% | 8% |
| Middle School Math | 28 | 10% | 0% | 85% | 3% |
| Middle School Science | 31 | 12% | 9% | 70% | 6% |
| Mathematics | 25 | 8% | 0% | 92% | 0% |
| Journalism | 13 | 0% | 0% | 100% | 0% |
| Japanese | 10 | 0% | 0% | 40% | 60% |
| Instrumental Music & General Knowledge | 12 | 16% | 0% | 83% | 0% |
| Vocal Music & General Knowledge | 12 | 8% | 8% | 83% | 0% |
As both Tables M and N demonstrate, the participation of non-White education experts remains woefully low even when ETS is able to recruit educators from multiple states. In a small sample of the 10 technical reports of multistate standard setting panels, 4 panels did not include a Black stakeholder, 5 did not include a Hispanic stakeholder, and in the case of the Journalism and Elementary generalist exams there was not a Black or Hispanic panelist. Ostensibly, according to ETS there was not a single Black or Hispanic journalism or elementary educator, faculty member, or administrator in the 40 states, territories, and associations where PRAXIS is used.
In sum, the cut scores for Indiana’s content and pedagogy teacher licensure exams were set by state specific and multistate panels composed of overwhelming White majorities of education stakeholders. Returning to some of the problems already established above with the Angoff method such as the should/would problem and unconscious bias, the demographic composition of the standard-setting “rooms” matter because of the high-stakes nature of these decisions on the livelihoods and career trajectories of the prospective educators sitting for these examinations. The psychological decisions about the characteristics of a “just qualified” candidate or whether the “just qualified” candidate can answer a particular test item are bound to be influenced by the racial composition of the panels.
According to ETS there was not a single Black or Hispanic journalism or elementary educator, faculty member, or administrator in the 40 states, territories, and associations where PRAXIS is used.
The research on the racial composition of juries provides a proxy to express the importance of racial diversity in groups where high-stakes decisions are made. Deliberation analyses of the effects of racial diversity illustrate clear advantages for group performance (Sommers 2010; Mitchell et al., 2007). For decades, research has made clear that racially heterogeneous juries provide more opportunities for information exchange. In other words, racially diverse juries deliberating about Black defendants feature more discussions of institutional racism or racial profiling because Black jurors are more likely to have personal experiences with racism or racial profiling (Sargent & Bradfield, 2004; Jehn et al., 1999). For example, Sommers (2007), in his study of the deliberations of racially homogeneous and racially heterogeneous juries, not only found this kind of informational exchange among heterogeneous juries, but also noted that these juries deliberated longer and considered a wider range of information (e.g., case facts, “missing evidence” and fewer objections when racism was mentioned). Indeed, the performance of White jurors was influenced in diverse juries because they were more amenable to discussing racism as a factor influencing their decisions by the diverse composition of the jury room.
Extending these findings to the expert panels created for teacher licensure exams, discussions about a “just qualified” candidate are also likely to be influenced by the racialized experiences of the panelists. Arguably, prospectively innocuous statements about what a “just qualified” candidate ought to know in social studies, such as familiarity with “the effects of historical events on economics, government as society” or “how people with different of different cultural backgrounds interact with their environment, self, family, neighborhoods, and organizations” (Social Studies Elementary subtest, ETS), are bound to look different to racially heterogeneous and homogeneous groups of expert panelists.
Potential test items about how this “just qualified” candidate might answer items about enslavement, Jim Crow laws, or the Civil Rights Movement will be processed by White and Black panelists differently, not only because of a lack of experiences (or lack thereof) with institutional racism, causing artificial individual ratings (Clauser, et al., 2016) but, also, because the discussions among panelists in a racially homogeneous room will feature less information exchange and more objections to the experiences of the low percentages of Black and Hispanic panelists in the room.
Deliberation analyses of the effects of racial diversity illustrate clear advantages for group performance.
In Indiana, the 47 panels analyzed in this report that helped construct teacher licensure exams and set passing cut scores were consistently composed of rooms where White educators and other education stakeholders were the dominant perspectives and voices on what the characteristics of a “just qualified” teacher looks like and how that “just qualified” candidate would answer certain test items.
Conclusions and Recommendations
Returning to the central premise of this report that Brown is not ancient history, the stories of low Black and Hispanic performance on teacher licensure exams and standard setting panels that feature overwhelmingly White subject-matter experts must be considered together as a reason for Indiana’s 92% White teacher workforce. This demographic reality is not because the educator workforce, policymakers, or the test vendors are explicitly seeking to suppress Black and Hispanic candidates’ progression into the profession. However, the teacher licensure exam system does function as a self-reinforcing loop to maintain White majorities.
According to Fenwick (2022), following desegregation, the number of Black teachers “diminished in every state but Florida, while White teachers were hired at increased levels in every state but Mississippi” (p. 14). Black teacher displacement was further exacerbated by teacher licensures exams such as NTE that were used to suppress Black wages and sustain White majorities. This system of exclusion was codified by the Supreme Court’s opinion that teacher licensure exams, as long as they were validated and germane to the profession, could continue to be used as a gatekeeping tool. As such, Indiana’s use of teacher licensure exams to determine entrance to the profession is an implicit descendant of this racist past, and, because this faith in the validation process has not been questioned, licensure exams continue to serve as the “constructive solution” that keep Black and Hispanic educators away from the classroom.
The analysis of the first attempt passing rates of the three different licensure exams (basic skills, pedagogy, and subject matter knowledge) required for certification between 2016 and 2021 revealed significant pass rate gaps between White and non-White candidates for virtually all exams. For example, the basic skills exam which consisted of three different subtests (mathematics, reading, and writing) — all of which need to be passed — has gaps as large as 29 percentage points between Black and White candidates. The pedagogy exam, a single test, while having higher overall first-time pass rates, still featured gaps between White and Black candidates as high as 18 percentage points. Finally, the subject matter knowledge exams, which depending on the area of concentration can be single or multiple subtests, also featured large pass rate gaps on virtually every single exam analyzed. The gaps between Black and White candidates were as large as 52 percentage points, and, in many cases, there were not enough Hispanic candidates (<10) taking a subject area test, during a given year, to provide a cross demographic analysis.
The presence of each of these gaps creates a winnowing effect on the prospective population of Black and Hispanic candidates each year. For example, the analysis of the English Language Arts subject matter knowledge exam between 2018 and 2021 revealed that of the 105 possible Black or Hispanic candidates, 85 (80%) were effectively discouraged from pursuing the profession.
The analysis of how teacher licensure exams are constructed and validated revealed that the panels for virtually all of the exams were composed primarily of White education stakeholders. Two distinct standard setting studies were conducted for the 47 teacher licensure exams in preparation of Indiana’s adoption of the PRAXIS in September, 2021. The first set of standard setting studies were comprised of only Indiana educators. Across these panels, 92% of the certified educators identified as White. Additionally, many of these panels (21/37) failed to meet the minimum threshold of six panelists. In some cases, such as the middle and secondary social studies exams only had one panelist determining test construction and cut scores.
The second set of standard setting studies were comprised of educators from across the states where the PRAXIS is used, including Indiana educators. Across the multistate panels, 81% of panelists identified as White; and two tests in particular, the Elementary generalist and Journalism panels, did not include a Black or Hispanic panelist. Given some of the problems with the standard setting method—which is the process that gave the Supreme Court in 1978 confidence in the validity of teacher licensure exams—these racially homogeneous panels are bound to be spaces where there is insufficient racial informational exchange, which is critical in judgements about high-stakes exams that affect the career trajectories of our demographically diverse population.
Because the standard setting studies, both state-wide and national, are generally composed of educators and educators in the United States and in Indiana are majority White, the standard setting process creates a closed loop that sustains a White majority. In other words, with a majority White teacher workforce on expert panels, the characteristics and responses of a “just qualified” candidate are validated from a majority White teacher framework, leading to adverse effects on candidates of color, which results in a majority White teacher workforce. Until this closed loop is interrupted, candidates of color will continue to be winnowed by teacher licensure exams.
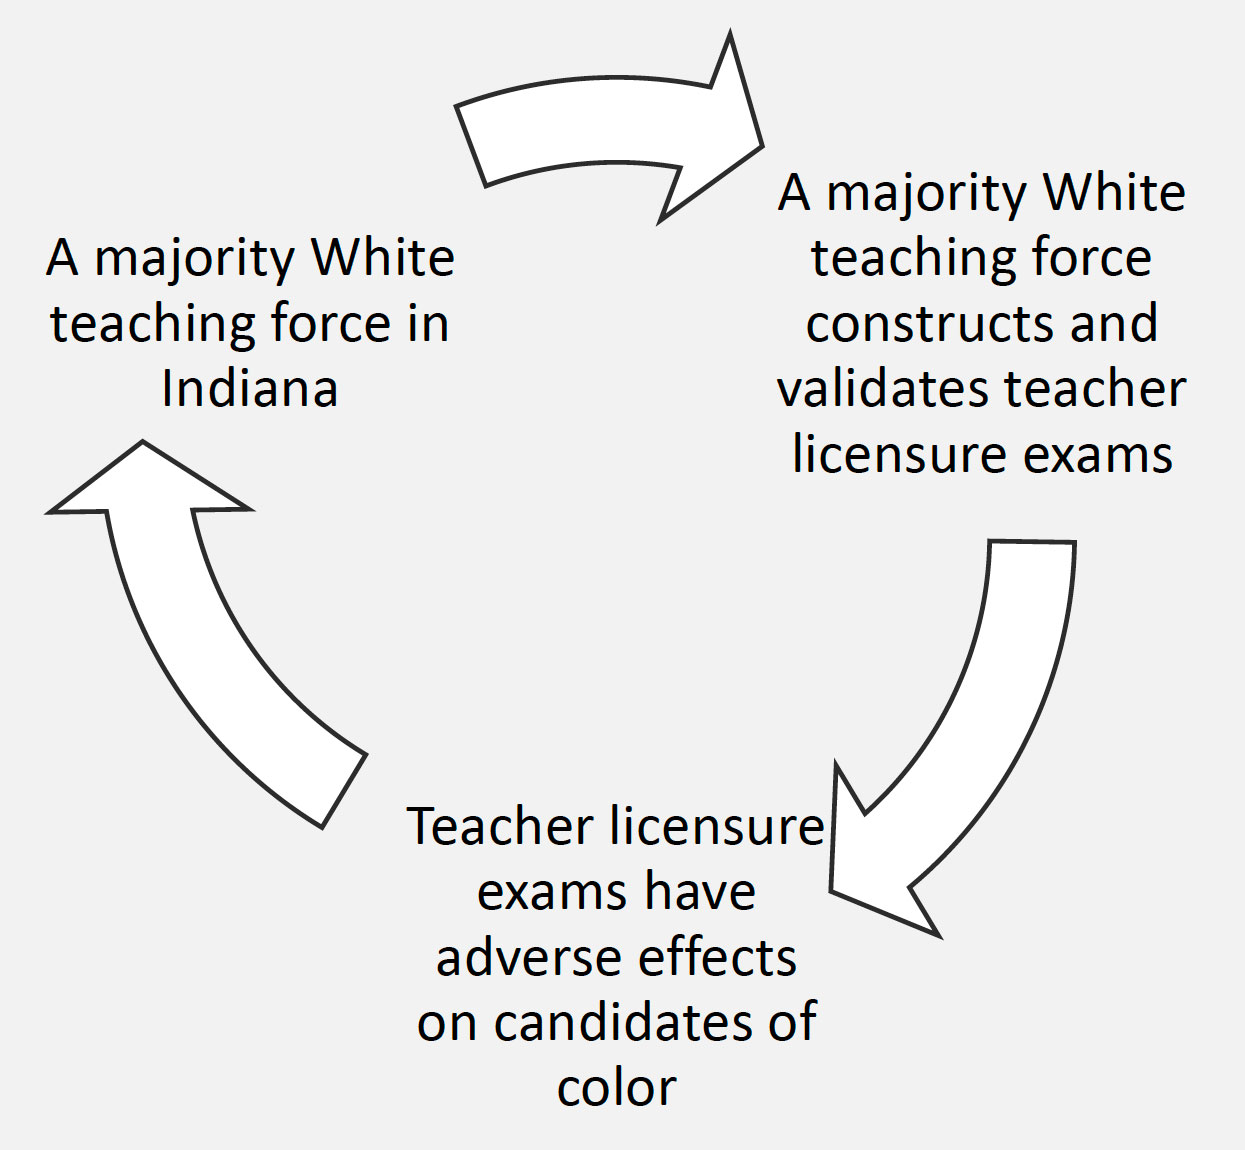
The demographic disparity of the teacher workforce in Indiana is not a function of openly racist individuals tinkering with teacher licensure exams. However, maintaining the belief that majority White panels can be colorblind and objective does sustain the racist legacy of teacher licensure exams. In particular, the Angoff method itself does not inspire confidence, despite the backing of the Supreme Court, because it is not a means of discovering an “objective standard” waiting to be discovered by a panel of experts. Simply put, the Angoff method remains unquestioned because it is germane to the profession, as long as certified educators are in the room. However, this colorblind approach has adverse effects on the financial prospects of teacher candidates of color, students of color who are rarely, if ever, taught by a teacher of color, and White students as well, who also benefit from learning from teachers of color. According to the Learning Policy Institute (2018), the impact of teachers of color is especially significant for students of color:
“…who have higher test scores, are more likely to graduate high school, and more likely to succeed in college when they have had teachers of color who serve as role models and support their attachment to school and learning. Students with racially diverse teachers also have fewer unexcused absences and are less likely to be chronically absent.”
Ultimately, ignoring the closed loop between a white majority teacher workforce, majority white panelists, and licensure exams that have adverse effects on teacher candidates of color fails all students in Indiana.
Recommendations
Based on the conclusions of this report, perhaps the easiest recommendation is for Indiana to abandon teacher licensure exams. However, an exam that helps determine entry into the profession is not the problem. Indeed, it is a common misconception that score differences automatically mean that an exam is biased. The exam might be biased, but differences alone are not necessarily indicative of bias. Yet, the outcomes of the exam—as this report makes clear—have adverse effects. Considering the adverse effects of disparate passing rates on teacher candidates of color allows for different questions to be asked. More specifically, questions about the construction of the exam itself and how the demographic composition of a panel of experts influences perspectives on the “just qualified” candidate or how a “just qualified” candidate might answer certain items.
Moreover, in light of recent policy efforts in several states to de-professionalize the teaching profession by abandoning all certification requirements such as licensure exams or bachelor’s degrees, abandoning licensure exams risks returning public education to the days where certification was a private event sponsored by a local school board that was susceptible to wildly different expectations and favoritism. Certification exams have a place in the licensing of teachers, in the same way exams signal professionalism in other fields such as medicine and law.
However given the clear adverse effects of licensure exams on teachers of color, faith in the validity of these exams must be reexamined. The recommendations below offer a path for policymakers, teacher educators, and education researchers to help mitigate the adverse effects of teacher licensure exams for candidates of color.
Requiring Vendors to Assemble Demographically Diverse Panels. One of the key findings of this report is that standard setting studies are demographically homogeneous. Although these studies are conducted with care, they are littered with guesses about what a “just qualified” candidate would do and should look like. Because demographic diversity is an important feature of any high stakes decision-making group, legislators and state education agencies should require vendors to conduct standard setting studies that are demographically heterogeneous. At minimum, all standard setting studies, with the possible exception of World Languages, should have equal representation from the demographic composition of the state of Indiana. Cut scores from panels that fail to meet that minimum threshold should be invalidated.
Recognizing the Financial Adversity of Licensure Exams for Candidates of Color. The disparities between White, Black, and Hispanic first-time pass rates means that Black and Hispanic candidates more often than White candidates have to pay to retake these exams. For some candidates of color, a second attempt or third attempt is financially prohibitive and serves as a barrier to the profession. The Indiana legislature, to its credit, has removed the “basic skills” exam as a requirement for certification, which lowers the overall cost of certification for teacher candidates—an important move during a time when many districts are experiencing teacher shortages. To ease the financial barrier of licensure exams, that have specific adverse effects for teachers of color, scholarship programs ought to be instituted for teachers of color to retake the pedagogy and subject matter licensure exams. These voucher programs can be legislatively funded or negotiated as part of the state contract with the testing vendor.
Increasing Financial Support for the Recruitment of Candidates of Color. Viewing the current demographic composition of the Indiana teaching force as a function of institutional racism, and not merely a problem of recruiting teachers of color, does not mean that support for recruitment programs should cease. In fact, programs such as the Rogers Student Teaching Scholarship for Minorities and the Crawford Minority Teacher Scholarship have financially assisted many talented teachers of color. However, the adverse effects of the teacher licensure examinations have served as barriers, in spite of these successful recruitment programs. Beyond these programs, greater investment is needed in (1) underwriting the cost of teacher preparation for teachers of color, particularly for students enrolled in minority serving institutions such as Goshen College, Indiana University-Northwest, and Martin University; (2) loan forgiveness programs that reimburse tuition costs of teacher candidates of color in exchange for a commitment to teach in underserved areas of Indiana; and (3) financially incentivizing highly effective education schools in Indiana to recruit and support more students of color and create partnerships with minority serving institutions.
Creating Collectives to Support Candidates of Color. The adverse effects of teacher licensure exams are not unknown to candidates of color. As the research of Emery Petchauer (2014) suggests, candidates of color struggle emotionally with test preparation and failure in unique ways because of their racialized lived experiences. As such, education schools must acknowledge this additional emotional toll and create programs and collectives that help candidates of color work together to achieve mastery on licensure exams. Collectives alone will not solve systemic “closed loop” problem with licensure exams, but they are a positive step that helps candidates of color not individualize success or failure on licensure exams.
Establishing GPA/Licensure Exams Flexibility Rules. Critics of teacher education programs often blame education schools for the low pass rates of teachers of color. As this report has made clear, these disparities are systemic. Although teacher preparation can do more to support candidates of color, such as the creation of collectives or greater institutional investment in underwriting the costs of teacher preparation, these supports are not necessary because of inadequate pedagogical or content preparation. To mitigate the adverse effects of licensure exams and signal trust in the professional preparation by institutions of higher education, Indiana policymakers should consider establishing flexibility rules that adjust passing scores based on the GPA of a particular candidates. New Jersey has established such rules that allow candidates that have either a high PRAXIS score or a high GPA to qualify for flexible passing scores. For example, the passing score for the Social Studies content exam is set at 157. However, a candidate with a 3.5 GPA or higher, only has to score a 149 on the exam to pass. This kind of flexibility would allow candidates of color with strong GPAs greater opportunities to pass on the first attempt.
Researching The Effects of Demographic Representation in Standard-Setting Studies. Because teacher licensure exams have adverse effects on teacher candidates of color, more research is needed on the cognitive processes of standard setting panelists. According to ETS researcher Irving Katz (2019), the standard setting literature “contains numerous recommendations and practical rules of thumb, but none of the recommendations are driven by detailed knowledge of what panelists think about to make their standard setting judgments” (p. 1). As such, more research is needed into to understand panelists’ cognitive processes. However, given the adverse effects of teacher licensure exams particularly on teachers of color, empirical attention must be given to the effects of race on the decision-making of teacher licensure standard setting panelists. Studies conducted by Sommers (2007, 2009, 2010) on the influence of race on juries provide a guide for education researchers to design and execute studies that help determine the effects of demographic heterogeneity and homogeneity on high-stakes decision-making groups.
Learning From The Research on Minority Serving Teacher Education Programs. Despite the efforts of many teacher education programs in the United States to recruit more candidates of color, these ventures are often undermined by coursework and field experiences that fail to acknowledge the complex issues of systemic inequality, racism, or marginalization (Delpit, 1995; Haddix, 2017; Scott & Rodriguez, 2015). Moreover, as this report illustrates, the adverse effect of teacher licensure exams for candidates of color further alienates efforts to retain Black and Hispanic teacher candidates. Instead of trying to innovate new recruitment and retention practices, teacher education programs must turn to the practices already found in the research on teacher education programs at Minority Serving Institutions (MSIs). These institutions have sustainable ways of recruiting, retaining, and preparing candidates of color. For example, research by Gasman and colleagues (2017) demonstrates how MSIs pay purposeful attention to high-stakes exams, create immersive experiences with K-12 schools, appreciate candidates of colors as community members, enact an asset-based model of culturally relevant teaching, and nurture culturally and linguistically diverse teachers. These practices at MSIs can provide critical lessons for teacher education programs that serve predominantly White candidates.
If teacher diversity is a true goal for the state of Indiana, new policies must be implemented to break the “closed loop” that has remained unquestioned since the adoption of the National Teacher Exam in 1985.
Funding. The research for this report was supported by funding from the Indiana University School of Education Proffitt Summer Faculty Fellowship Program.
About the Author. Alexander Cuenca, Ph.D. is Associate Professor of Curriculum & Instruction, Coordinator of the Middle/Secondary Social Studies Education Program, and Faculty Fellow at the Center Evaluation and Education Policy at Indiana University, Bloomington. His research focuses on social studies teacher education, the pedagogy of teacher education, and teacher education policy. Dr. Cuenca’s research has appeared in journals such as Journal of Teacher Education, Theory & Research in Social Education, and Teaching and Teacher Education. He has served on the executive boards of the National Council for the Social Studies, the College and University Faculty Assembly, and the Indiana Association of Colleges for Teacher Education.
Edited by: Christopher Lubienski, Ph.D., and Jason Curlin, Center for Evaluation and Education Policy
References
Albers, P. (2002). Praxis II and African American teacher candidates (or, is everything black bad?). English Education, 34(2), 105-125.
Baker, S. (1995). Testing Equality: The National Teacher Examination and the NAACP's Legal Campaign to Equalize Teachers' Salaries in the South, 1936–63. History of Education Quarterly, 35(1), 49-64.
Bennett, C. I., McWhorter, L. M., & Kuykendall, J. A. (2006). Will I ever teach? Latino and African American students’ perspectives on PRAXIS I. American Educational Research Journal, 43(3), 531-575.
Blanton, H., & Jaccard, J. (2008). Unconscious racism: A concept in pursuit of a measure. Annual Review of Sociology, 34(1), 277-297.
Brandon, P. R. (2004). Conclusions about frequently studied modified Angoff standard-setting topics. Applied Measurement in Education, 17(1), 59-88.
Bristol, T. J., & Martin-Fernandez, J. (2019). The added value of Latinx and Black teachers for Latinx and Black students: Implications for policy. Policy Insights from the Behavioral and Brain Sciences, 6(2), 147- 153.
Clauser, J. C., Hambleton, R. K., & Baldwin, P. (2017). The effect of rating unfamiliar items on Angoff passing scores. Educational and psychological measurement, 77(6), 901-916.
Darling-Hammond, L., Sutcher, L., & Carver-Thomas, D. (2018). Teacher Shortages in California: Status, Sources, and Potential Solutions. Research Brief. Learning Policy Institute.
Educational Testing Service (2021). Multistate Standard Setting Technical Report: PRAXIS Mathematics (5165). ETS.
Elsbree, W. S. (1939). The American teacher: Evolution of a profession in a democracy. American Book Company.
Epstein, K. K. (2005). The whitening of the American teaching force: A problem of recruitment or a problem of racism? Social Justice, 32(3 (101), 89-102.
Fenwick, L. T. (2022). Jim Crow's Pink Slip: The Untold Story of Black Principal and Teacher Leadership. Harvard Education Press.
Fowell, S. L., Fewtrell, R., & McLaughlin, P. J. (2008). Estimating the minimum number of judges required for test-centered standard setting on written assessments. Do discussion and iteration have an influence? Advances in Health Sciences Education, 13(1), 11-24.
Giraud, G., & Impara, J. C. (2005). Making the cut: The cut score setting process in a public school district. Applied Measurement in Education, 18(3), 289-312.
Gitomer, D. H., Brown, T. L., & Bonett, J. (2011). Useful signal or unnecessary obstacle? The role of basic skills tests in teacher preparation. Journal of Teacher Education, 62(5), 431-445.
Goldhaber, D. (2007). Everyone’s doing it, but what does teacher testing tell us about teacher effectiveness? Journal of Human Resources, 42(4), 765-794.
Goldhaber, D., & Hansen, M. (2010). Race, gender, and teacher testing: How informative a tool is teacher licensure testing? American Educational Research Journal, 47(1), 218-251.
Indiana Department of Education (2020). Public Comment Document, Overview of the Indiana Score-Setting Workshops. https://www.in.gov/sboe/board-meetings-and-materials/board-meetings-and-materials/december-9-2020/
Irvine, J. J. (1989). Beyond role models: An examination of cultural influences on the pedagogical perspectives of Black teachers. Peabody Journal of Education, 66(4), 51-63.
Jehn, K. A., Northcraft, G. B., & Neale, M. A. (1999). Why differences make a difference: A field study of diversity, conflict and performance in workgroups. Administrative Science Quarterly, 44(4), 741-763.
Katz, I. R. (2019). Standard Setting Panelist Cognition: A Framework and Implications for Practice. ETS Research Report Series, 2019.
Kirby, S. N., & Hudson, L. (1993). Black teachers in Indiana: A potential shortage?. Educational Evaluation and Policy Analysis, 15(2), 181-194.
Loughlin, S. (2015, October 31). Aspiring teachers stuck without a license. The Tribune Star.
Loughlin, S. (2019, October 26). Current provider’s teacher testing exams criticized, yield low pass rates. The Herald Bulletin.
Margolis, M. J., Mee, J., Clauser, B. E., Winward, M., & Clauser, J. C. (2016). Effect of content knowledge on angoff-style standard setting judgments. Educational Measurement: Issues and Practice, 35(1), 29-37.
McDaniel, T. R. (1977). The NTE and teacher certification. The Phi Delta Kappan, 59(3), 186-188.
McGinty, D. (2005). Illuminating the" black box" of standard setting: An exploratory qualitative study. Applied Measurement in Education, 18(3), 269-287.
Milner, H. R. (2006). The Promise of Black Teachers' Success with Black Students. Educational Foundations, 20, 89-104.
Mitchell, T. L., Haw, R. M., Pfeifer, J. E., & Meissner, C. A. (2005). Racial bias in mock juror decision-making: A meta-analytic review of defendant treatment. Law and Human Behavior, 29(6), 621-637.
Naman, W. (2009). Who should teach Black students? Research on the role of White and Black teachers in American schools. Ethnicity and Race in a Changing World, 1(2), 26-39.
Nettles, M. T., Scatton, L. H., Steinberg, J. H., & Tyler, L. L. (2011). Performance and passing rate differences of African American and white prospective teachers on Praxis examinations: a joint project of the National Education Association (NEA) and Educational Testing Service (ETS). ETS Research Report Series, 2011
Petchauer, E. (2015). Passing as white: Race, shame, and success in teacher licensure testing events for Black preservice teachers. Race Ethnicity and Education, 18(6), 834-857.
Petchauer, E. (2018). Navigating teacher licensure exams: Success and self-discovery on the high-stakes path to the classroom. Routledge
Peterson, E. R., Rubie-Davies, C., Osborne, D., & Sibley, C. (2016). Teachers' explicit expectations and implicit prejudiced attitudes to educational achievement: Relations with student achievement and the ethnic achievement gap. Learning and Instruction, 42, 123-140.
Plake, B. S., Impara, J. C., & Irwin, P. M. (2000). Consistency of Angoff‐Based Predictions of Item Performance: Evidence of Technical Quality of Results From the Angoff Standard Setting Method. Journal of Educational Measurement, 37(4), 347-355.
Quirk, T. J., Witten, B. J., & Weinberg, S. F. (1973). Review of studies of the concurrent and predictive validity of the National Teacher Examinations. Review of Educational Research, 43(1), 89-113
Sargent, M. J., & Bradfield, A. L. (2004). Race and information processing in criminal trials: Does the defendant’s race affect how the facts are evaluated?. Personality and Social Psychology Bulletin, 30(8), 995-1008.
Sedlak, M. (2008). ‘Competing Visions of Purpose, Practice, and Policy’. In M. Cochran-Smith, S., Feiman-Nemser & J. McIntyre, eds. Handbook of Research on Teacher Education. 3rd edition. Routledge.
Sommers, S. R. (2007). Race and the decision making of juries. Legal and Criminological Psychology, 12(2), 171-187.
Sommers, S. R. (2010). What we do (and don't) know about race and jurors. Jury Expert, 22(1).
Spencer, S. J., Logel, C., & Davies, P. G. (2016). Stereotype threat. Annual Review of Psychology, 67(1), 415-437.
Toch, T. (1983, January 19). Tests exclude Blacks from teaching profession. Education Week.
Wilson, A. J. (1986, November). Historical issues of validity and validation: The National Teacher Examinations [Paper presentation]. American Educational Research Association Conference, San Francisco, California. https://eric.ed.gov/?id=ED270503